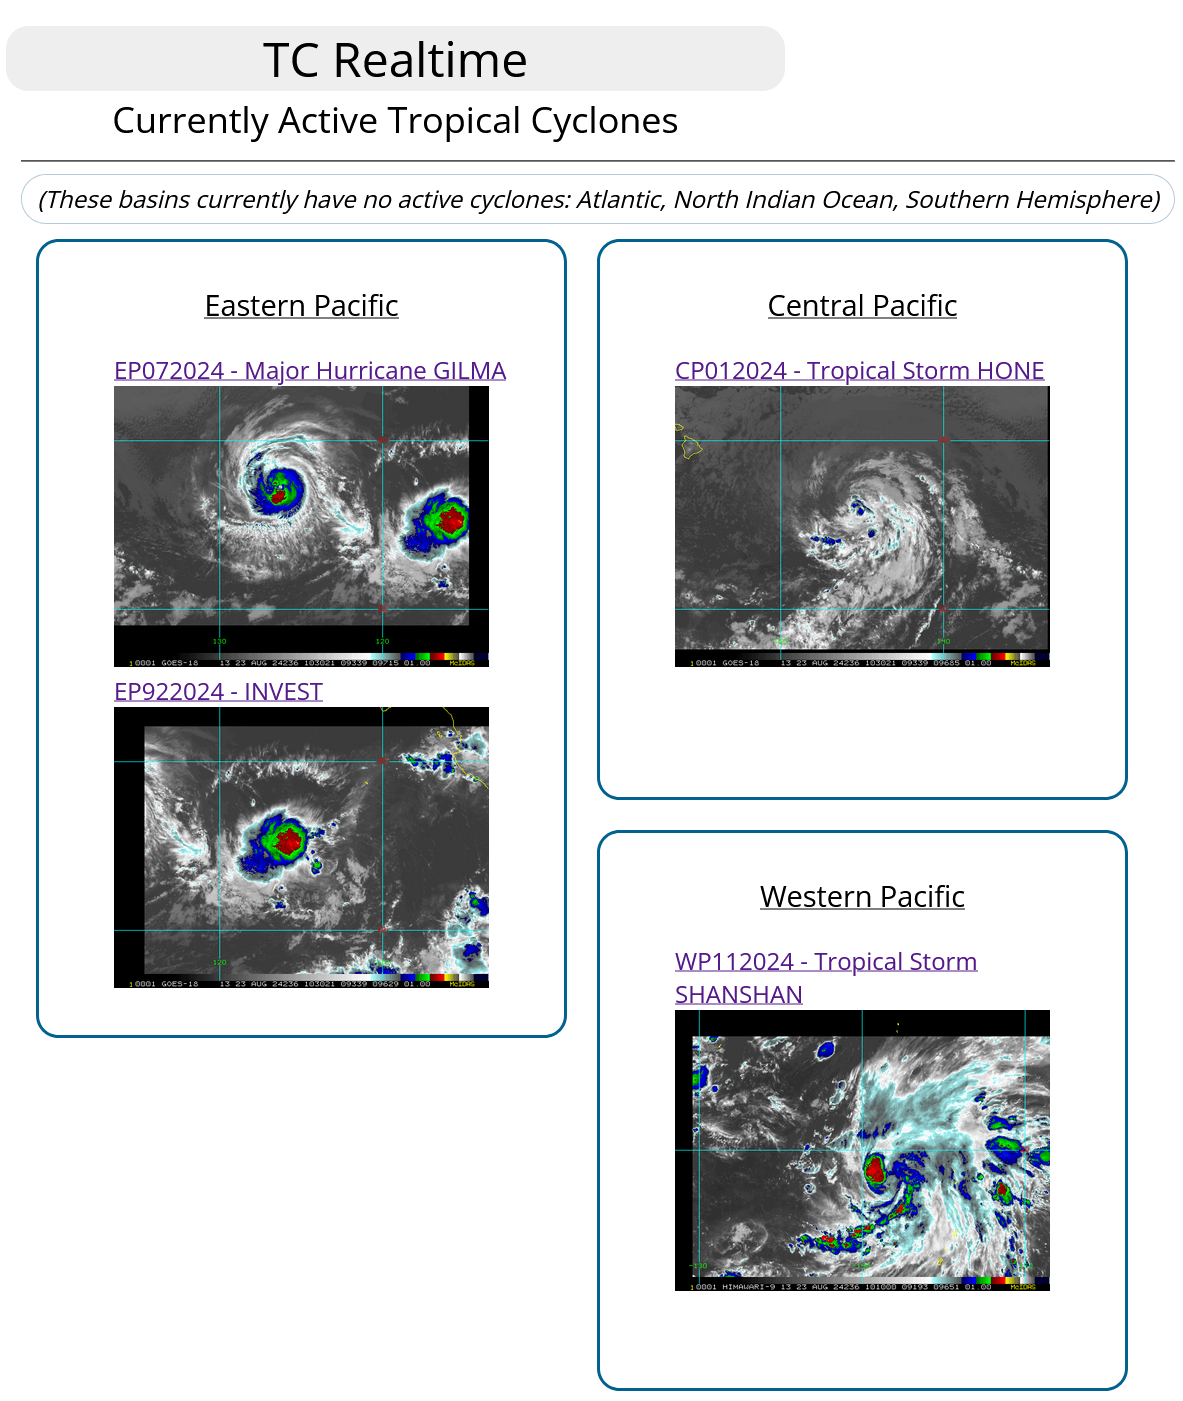
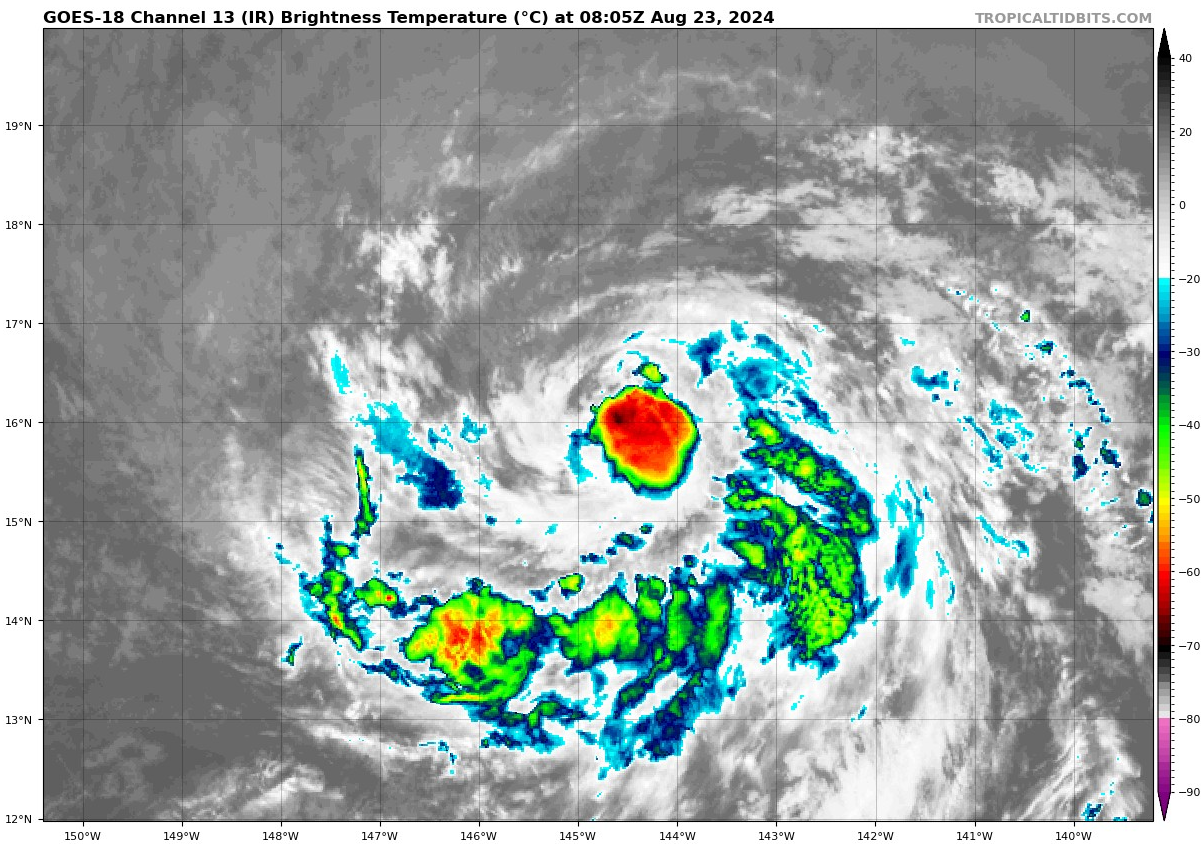
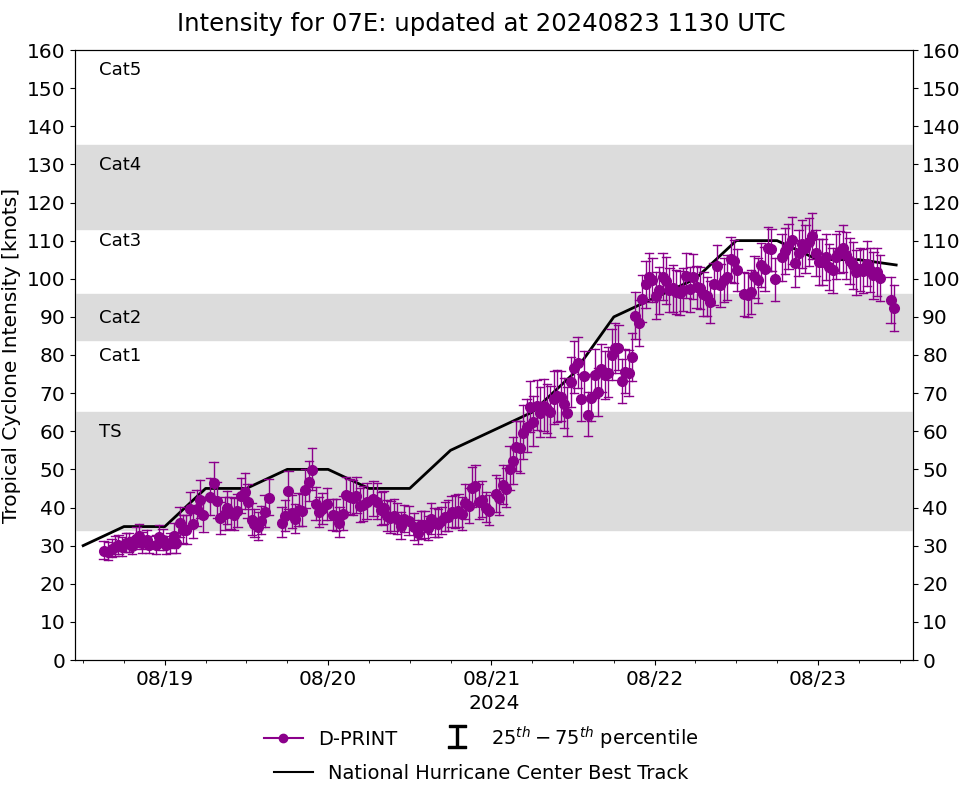
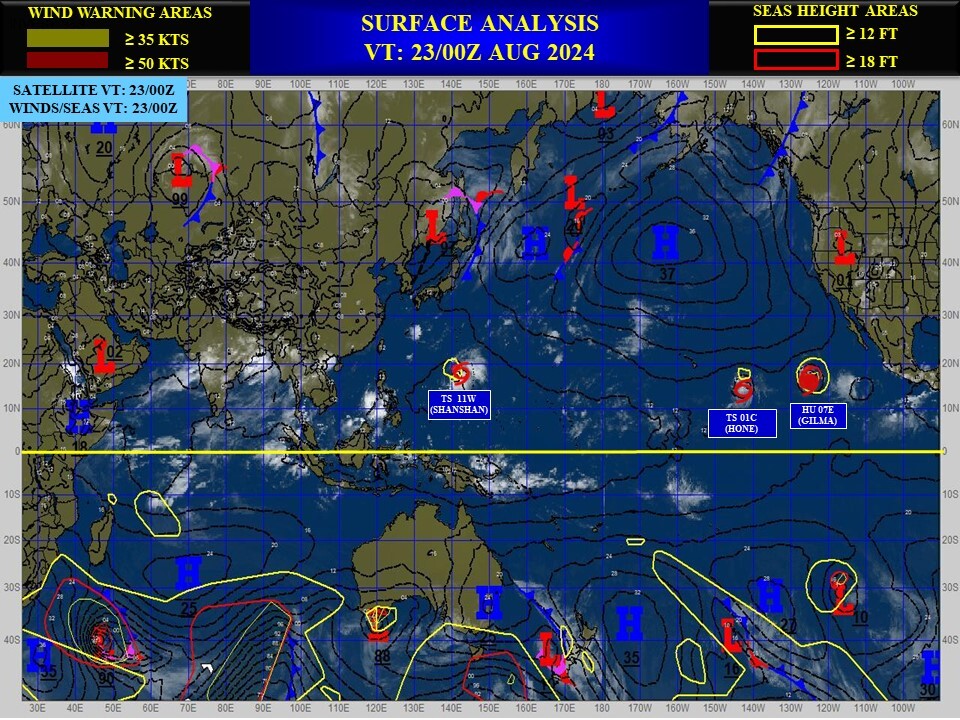
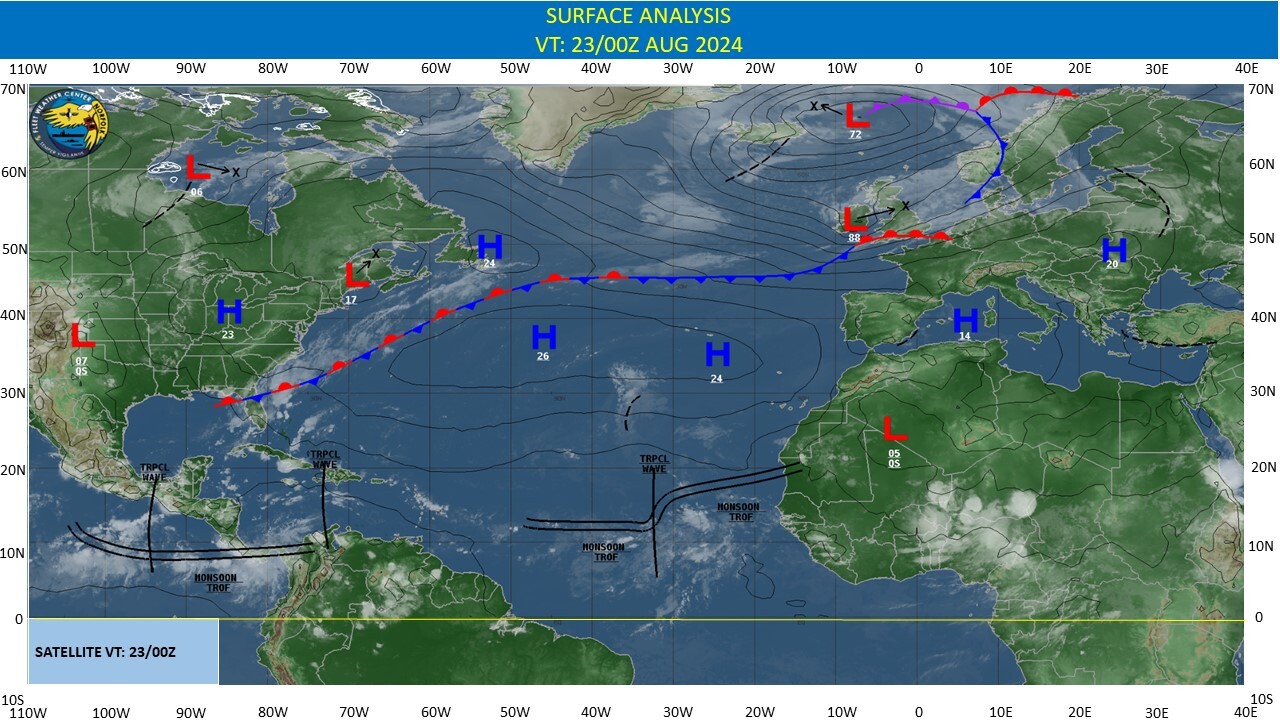
CLICK ON THE IMAGERIES BELOW TO GET THEM ENLARGED
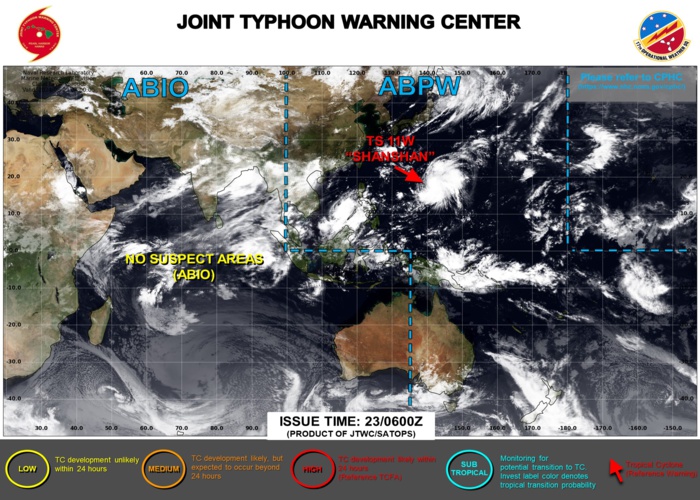
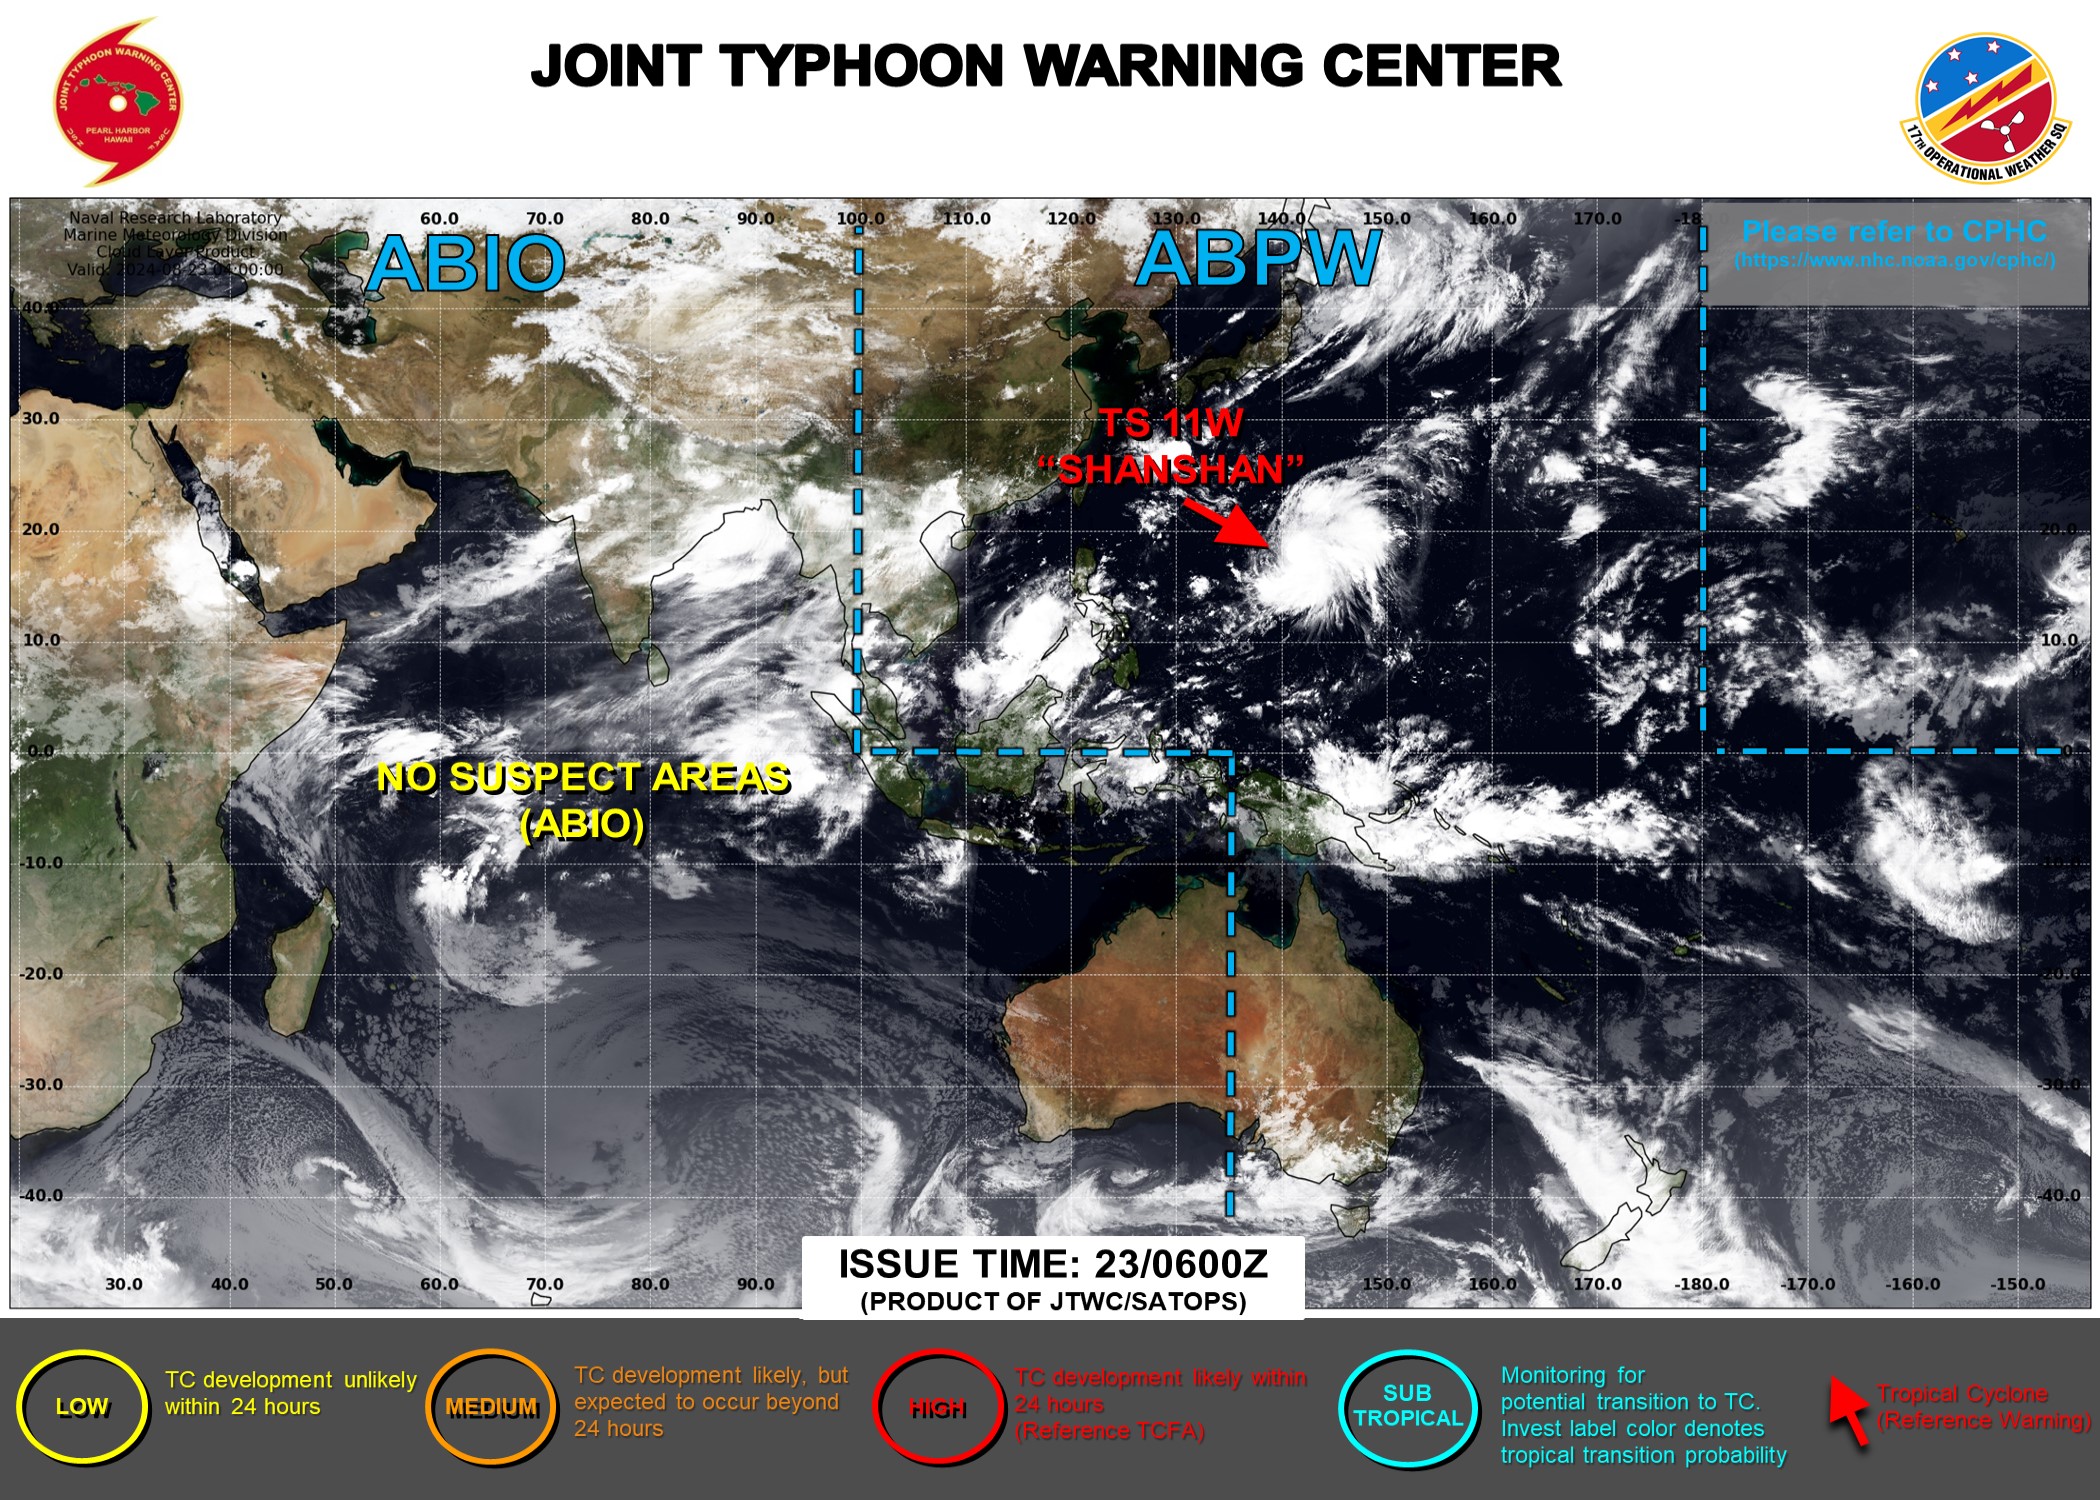
JTWC IS ISSUING 6HOURLY WARNINGS ON 11W, ON 01C AND ON 07E. 3HOURLY SATELLITE BULLETINS ARE ISSUED ON 11W AND 01C.
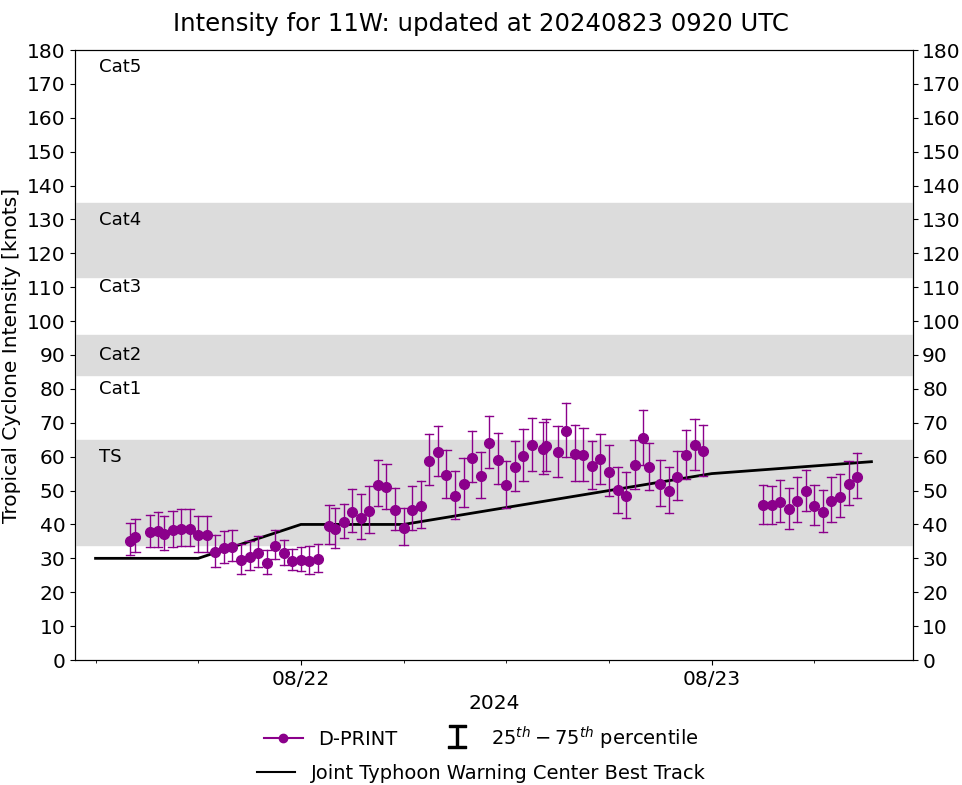
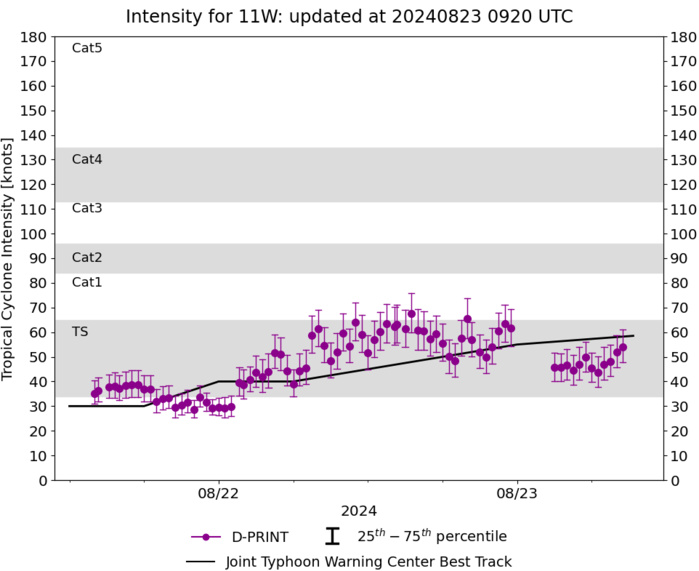
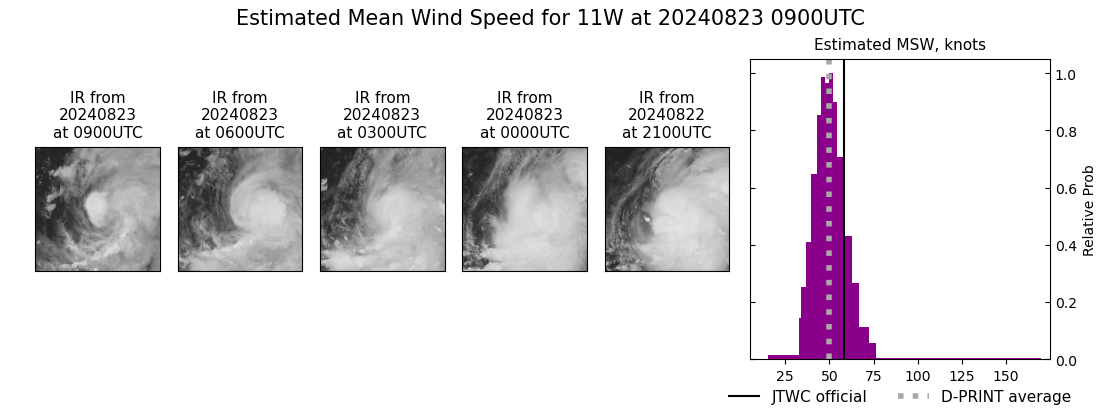
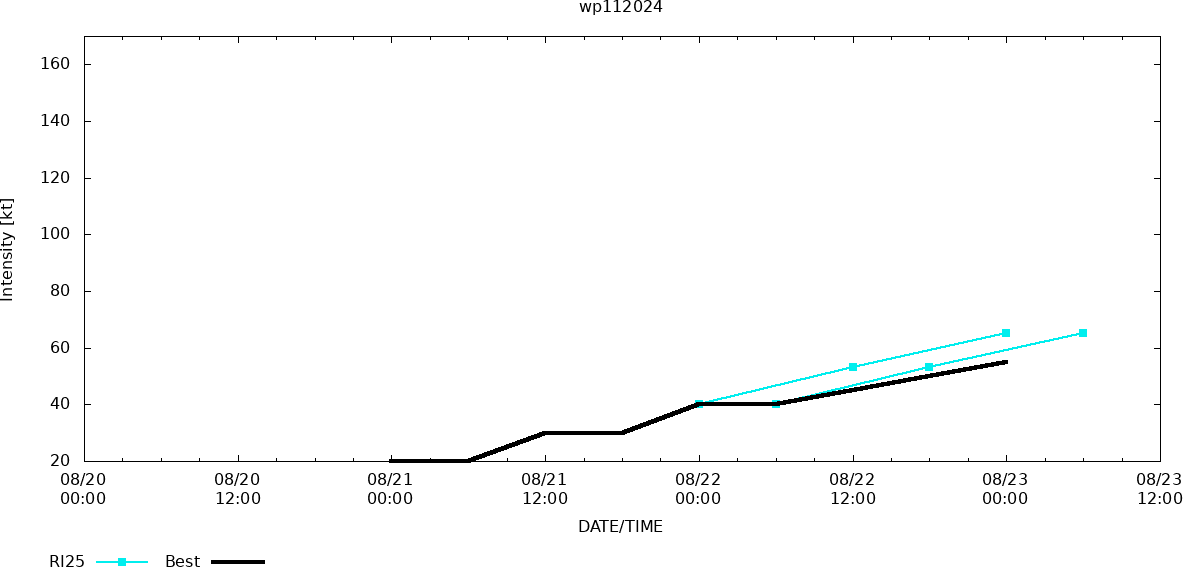
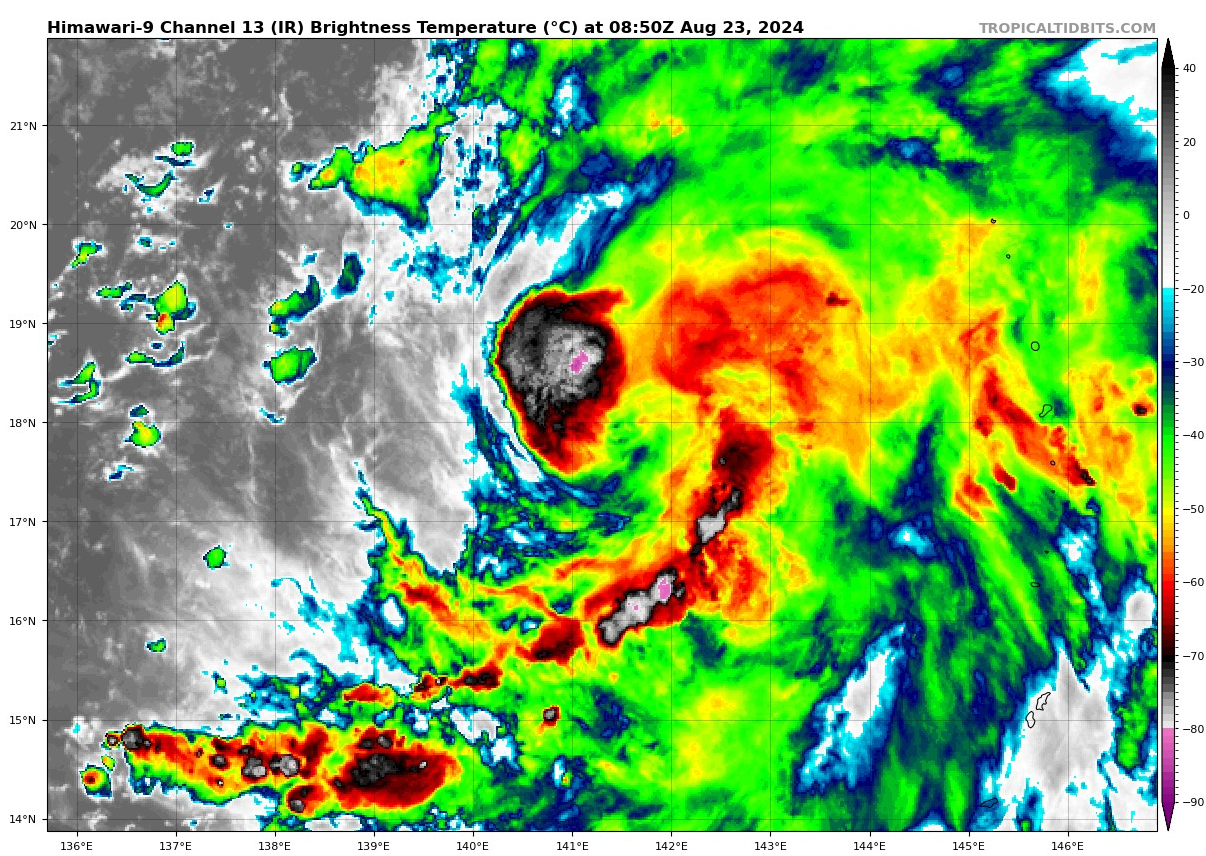
WESTERN NORTH PACIFIC: TS 11W(SHANSHAN). 23/06UTC ESTIMATED INTENSITY IS 60 KNOTS: + 20 KNOTS OVER 24H
1124082006 160N1467E 15
1124082012 156N1460E 15
1124082018 153N1454E 15
1124082100 158N1443E 20
1124082106 165N1434E 20
1124082112 169N1427E 30
1124082118 170N1422E 30
1124082200 169N1414E 40
1124082206 169N1411E 40
1124082212 170N1409E 45
1124082218 174N1410E 55
1124082300 176N1411E 55
1124082306 178N1412E 60
1124082012 156N1460E 15
1124082018 153N1454E 15
1124082100 158N1443E 20
1124082106 165N1434E 20
1124082112 169N1427E 30
1124082118 170N1422E 30
1124082200 169N1414E 40
1124082206 169N1411E 40
1124082212 170N1409E 45
1124082218 174N1410E 55
1124082300 176N1411E 55
1124082306 178N1412E 60
WARNING 8 ISSUED AT 2309UTC
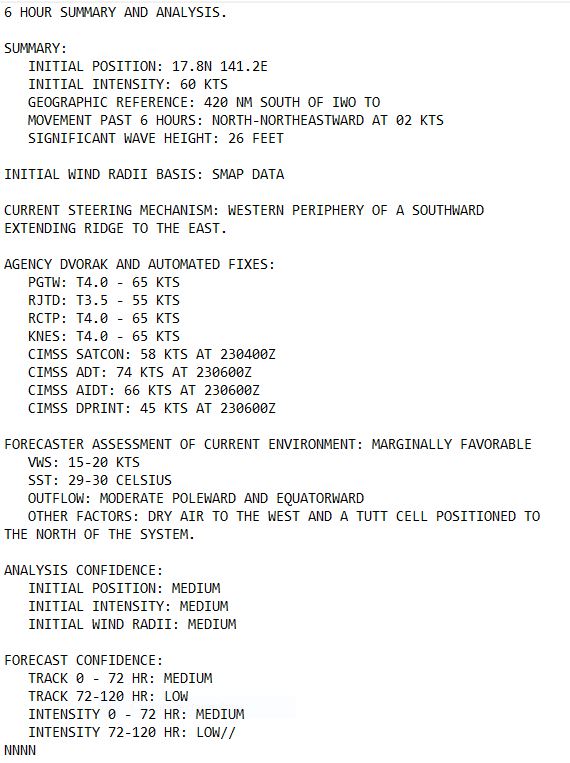
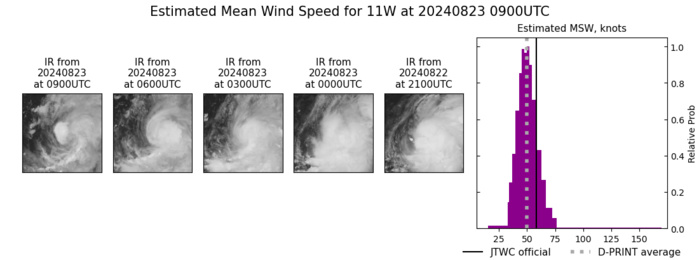
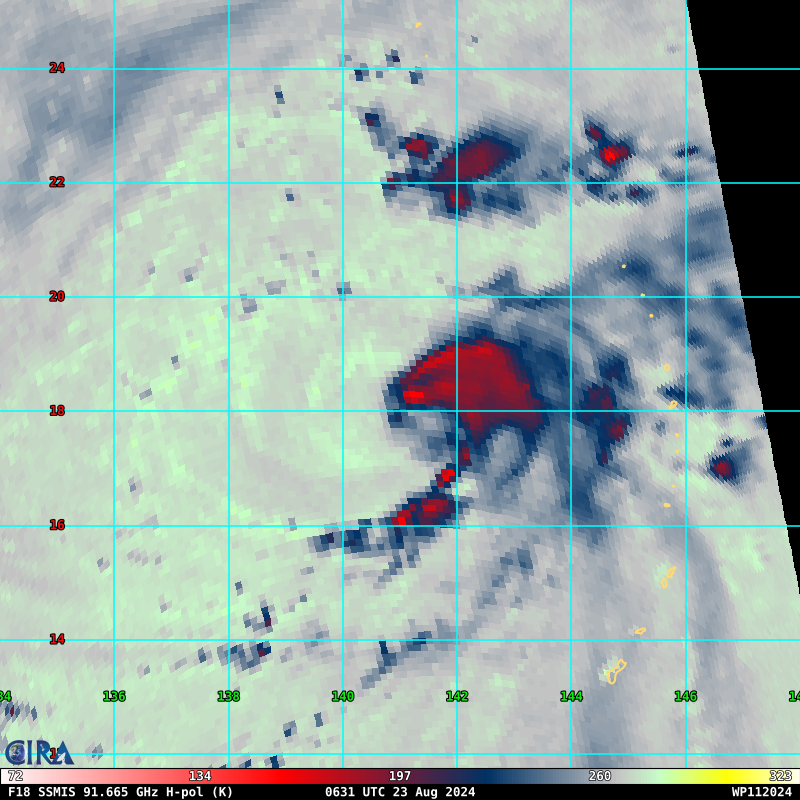
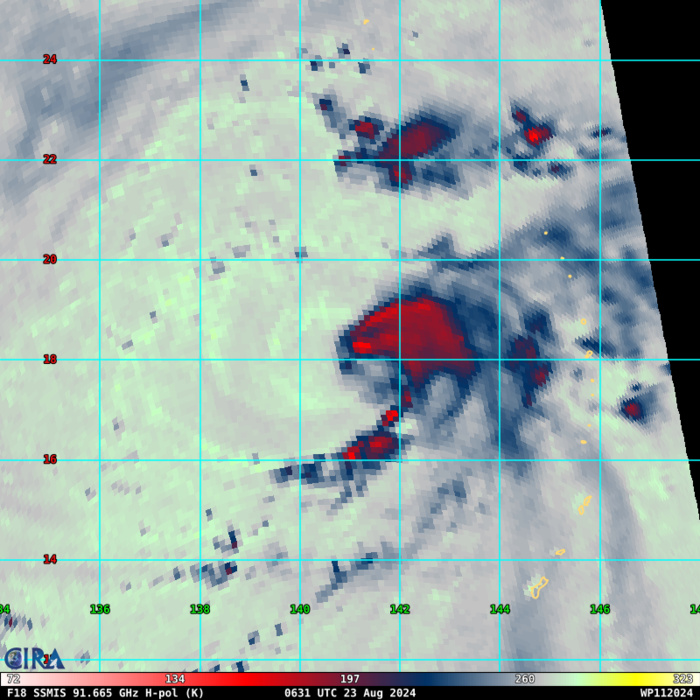
SATELLITE ANALYSIS, INITIAL POSITION AND INTENSITY DISCUSSION: ANIMATED MULTISPECTRAL SATELLITE IMAGERY (MSI) DEPICTS TROPICAL STORM 11W (SHANSHAN) AS A COMPACT SYSTEM WITH STRONG CONVECTIVE BANDING FEATURES ALONG THE SOUTHERN PERIPHERY. APPARENT DRY AIR IS INTRUDING ON THE WESTERN PORTION OF 11W, HINDERING CONVECTIVE DEVELOPMENT IN THAT REGION. ADDITIONALLY, THE TUTT CELL POSITIONED TO THE NORTH OF 11W IS CAUSING INCREASED WESTERLY SHEAR. THESE TWO FACTORS ARE CAUSING THE WESTERN SEMICIRCLE OF THE DEFINED LOW-LEVEL CIRCULATION CENTER (LLCC) TO BE PARTIALLY EXPOSED. ENVIRONMENTAL ANALYSIS INDICATES THAT 11W IS IN A MARGINALLY FAVORABLE ENVIRONMENT FOR FURTHER INTENSIFICATION CHARACTERIZED BY MODERATE POLEWARD AND EQUATORWARD OUTFLOW ALOFT, MODERATE WESTERLY VERTICAL WIND SHEAR, THE PRESENCE OF DRY AIR, AND WARM SEA SURFACE TEMPERATURES. THE INITIAL POSITION IS PLACED WITH MEDIUM CONFIDENCE BASED ON THE ANIMATED MSI IMAGERY AND A 230625Z SSMIS 91 GHZ MICROWAVE IMAGE SHOWING THE LOW-LEVEL CLOUD LINES JUST WEST OF THE DEEP CONVECTION. THE INITIAL INTENSITY OF 60 KTS IS ASSESSED WITH MEDIUM CONFIDENCE BASED ON THE OBJECTIVE AND SUBJECTIVE INTENSITY ESTIMATES LISTED BELOW.
TC Warning Graphic
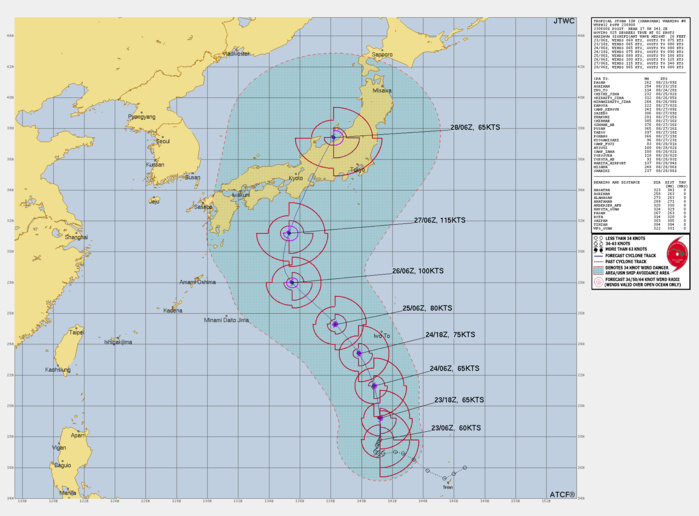
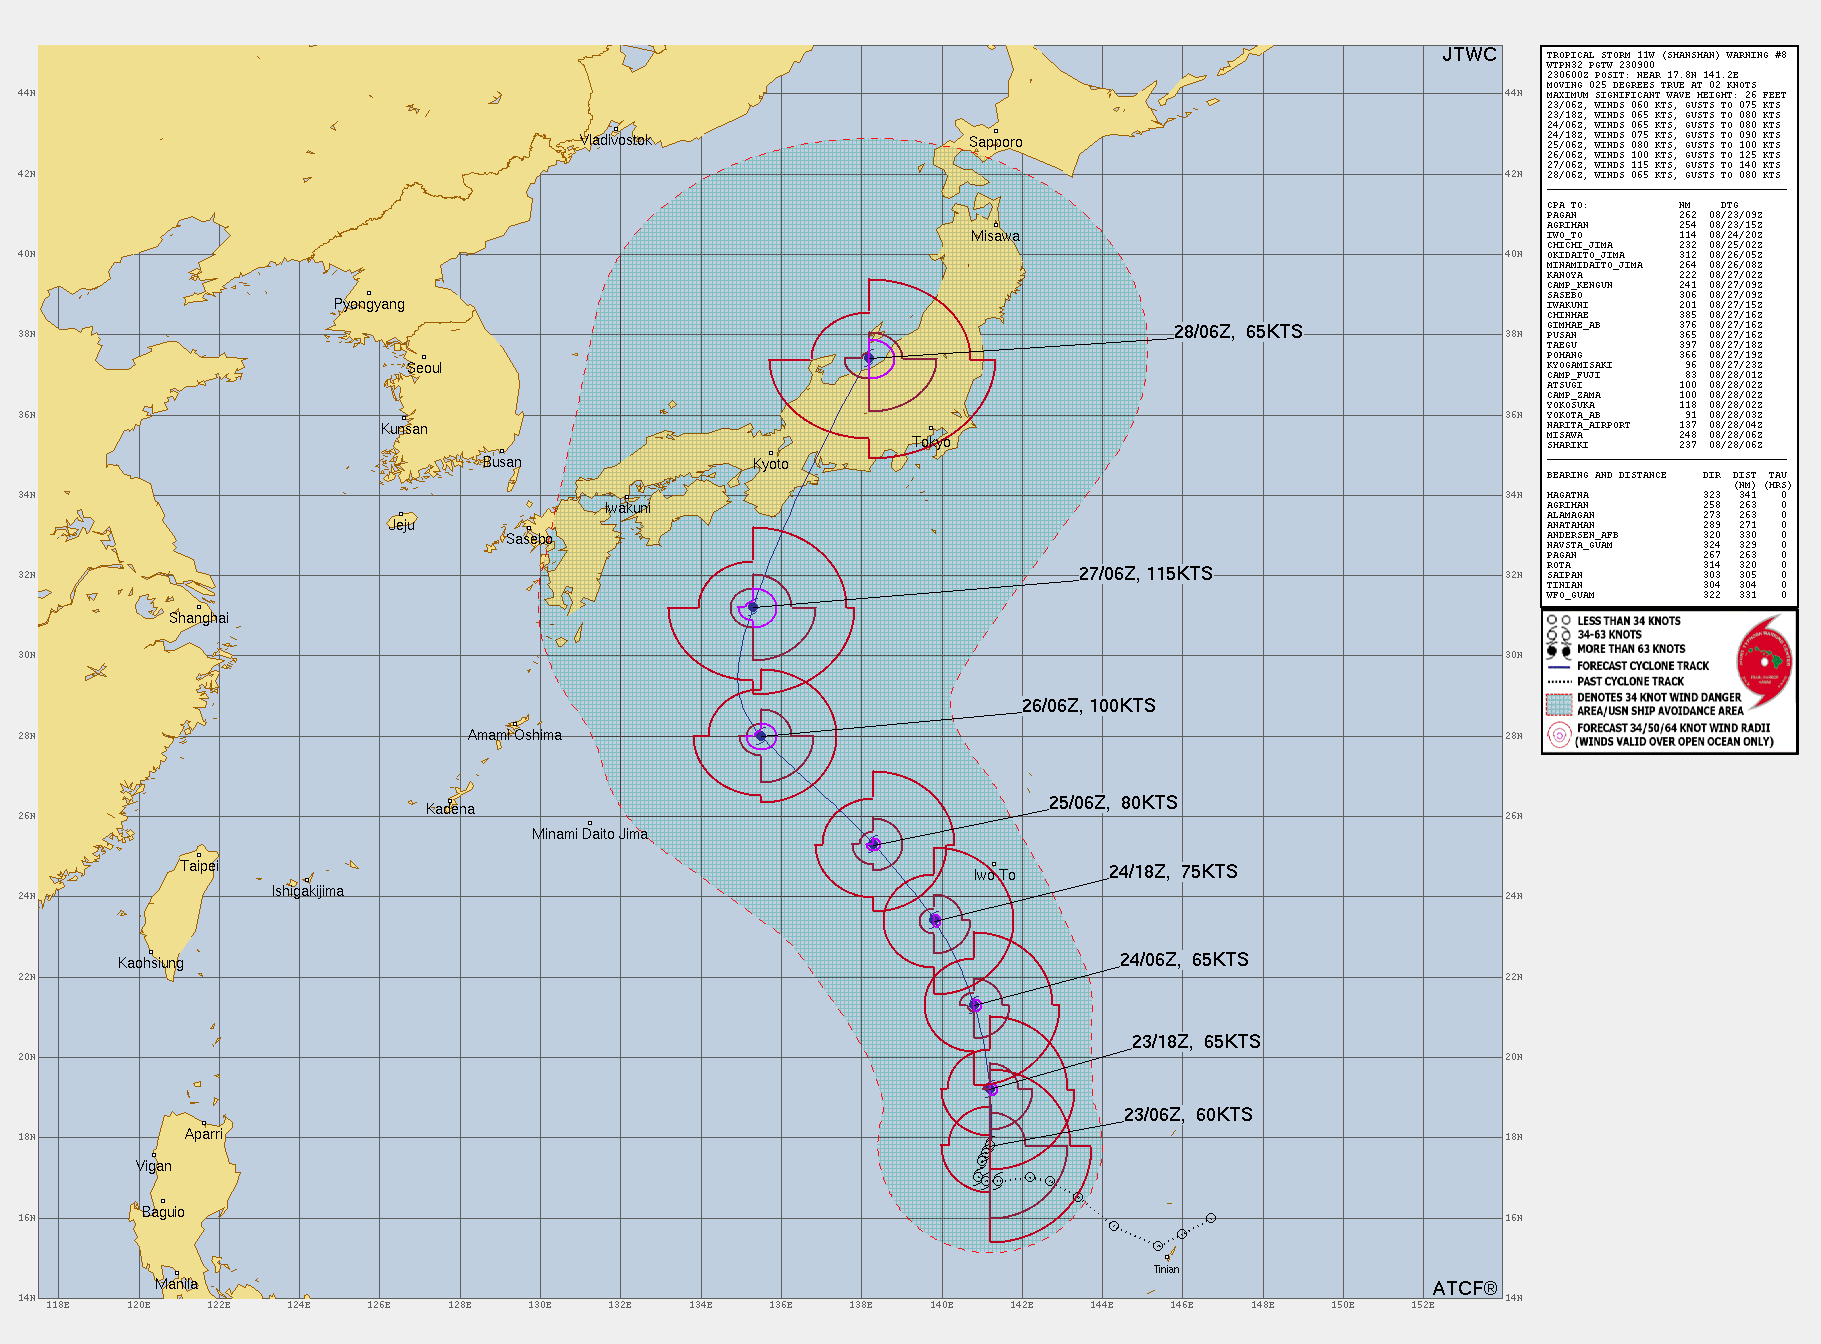
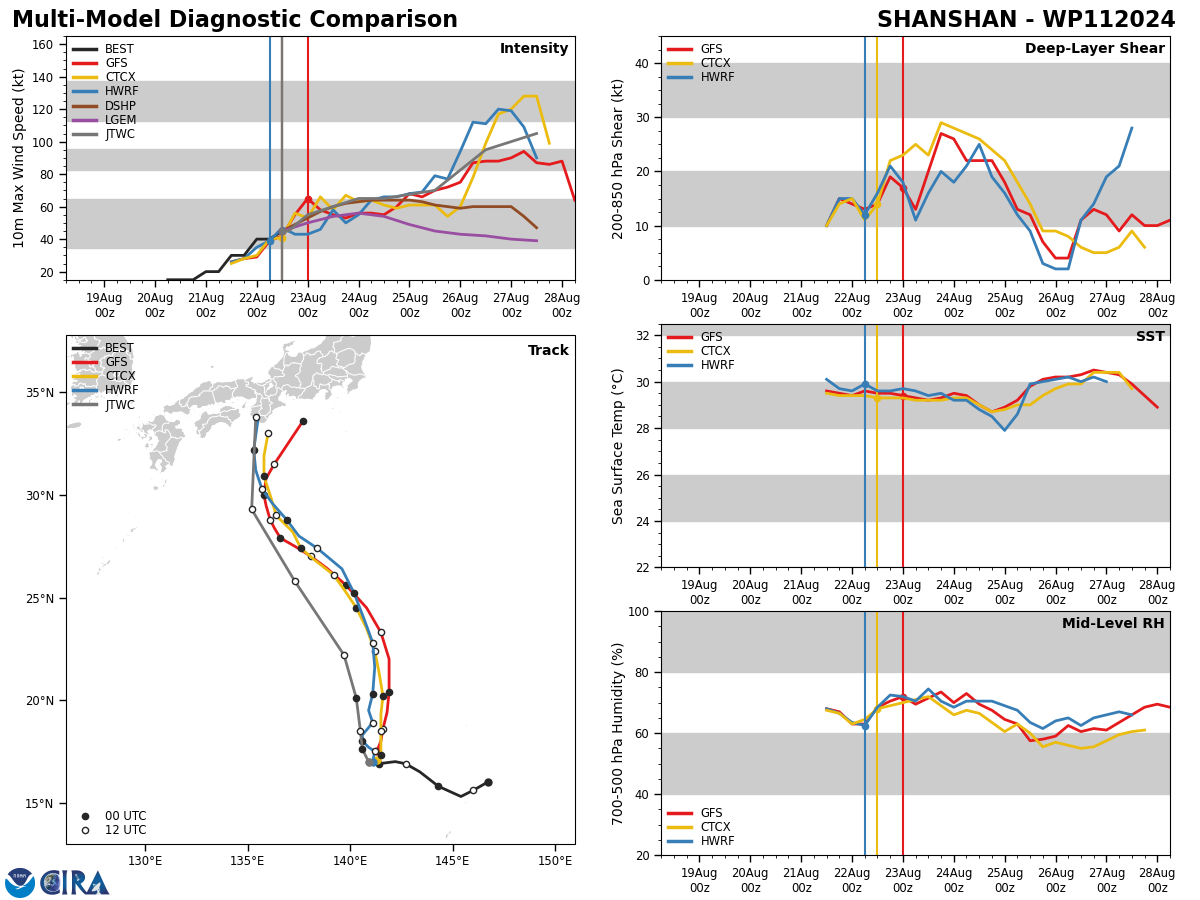
FORECAST REASONING. SIGNIFICANT FORECAST CHANGES: THERE ARE NO SIGNIFICANT CHANGES TO THE FORECAST FROM THE PREVIOUS WARNING. FORECAST DISCUSSION: 11W IS FORECAST TO CONTINUE TRACKING GENERALLY NORTHWARD THROUGH TAU 24, ALONG THE WESTERN PERIPHERY OF THE RIDGING TO ITS EAST. AFTER TAU 24, A BUILDING SUBTROPICAL RIDGE (STR) POSITIONED EAST OF HONSHU WILL TURN THE SYSTEM NORTHWESTWARD THROUGH TAU 72. AFTER TAU 72, 11W IS EXPECTED TO ROUND THE STR AND MAKE ITS WAY NORTHEASTWARD TOWARDS HONSHU BEFORE MAKING LANDFALL NEAR TAU 108. REGARDING INTENSITY, 11W IS FORECAST TO STEADILY INTENSIFY TO 80 KTS AT TAU 48 DUE TO THE UNFAVORABLE PLACEMENT OF THE TUTT CELL. AFTER TAU 48, THE TUTT CELL WILL HAVE PROPAGATED FAR ENOUGH SOUTHWESTWARD TO ALLOW VERTICAL WIND SHEAR TO DRASTICALLY DROP WHICH WILL INTENSIFY 11W AS A RESULT. AN INTENSITY OF 115 KTS IS FORECASTED AT TAU 96, BUT THE PEAK INTENSITY OF THE SYSTEM MAY OCCUR AFTERWARDS, JUST BEFORE LANDFALL. AS THE VORTEX MAKES LANDFALL IN HONSHU, TERRAIN INTERACTION WILL QUICKLY BEGIN WEAKENING THE SYSTEM TO AROUND 65 KTS NEAR THE END OF THE FORECAST PERIOD.
Model Diagnostic Plot
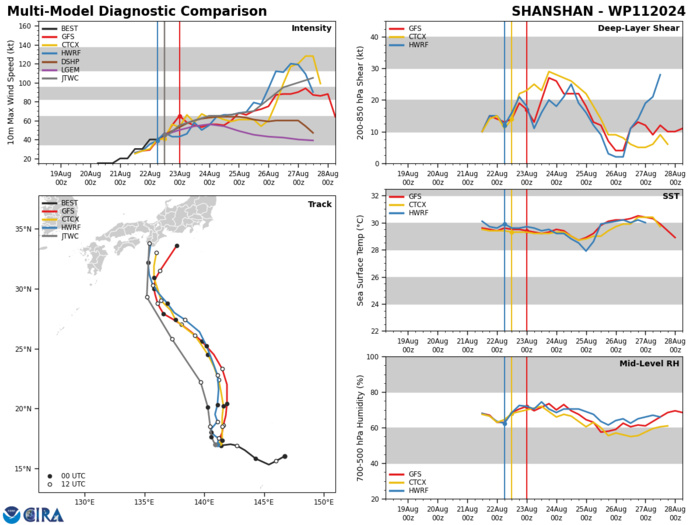
MODEL DISCUSSION: NUMERICAL MODEL GUIDANCE IS IN GOOD AGREEMENT THROUGH TAU 96, WITH A CROSS-TRACK SPREAD OF 118 NM AT THAT TIME. HOWEVER, AFTER TAU 96, MODELS BEGIN TO SLIGHTLY DISAGREE ON THE SHARPNESS OF THE NORTHEASTWARD TURN. ECMWF AND GFS DETERMINISTIC MODELS BOTH TURN THE SYSTEM SHARPLY, TRACKING NEAR TOKYO AT TAU 120. THE ENSEMBLE MEAN VARIANTS AS WELL AS HAFS-A AND NAVGEM, ALL TRACK THE SYSTEM MORE NORTH-NORTHEASTWARD AS IT ROUNDS THE STR. THE JTWC TRACK FORECAST IS PLACED CLOSE TO CONSENSUS THROUGH TAU 96, AND CLOSER TO THE BULK OF GUIDANCE AFTERWARDS. IF FUTURE MODEL RUNS BEGIN DRIFTING CLOSER TO TOKYO, A SHIFT OF THE TRACK SOUTHEASTWARD COULD ENSUE. OVERALL, THERE IS MEDIUM CONFIDENCE IN THE JTWC TRACK THROUGH TAU 72 AND LOW THEREAFTER. INTENSITY GUIDANCE IS IN GOOD AGREEMENT THROUGH TAU 48, DEPICTING A GRADUAL INTENSIFICATION TREND. AFTER TAU 48, MODELS BEGIN TO HIGHLY DISAGREE ON THE PEAK INTENSITY OF THE SYSTEM. HAFS-A DEPCITS A PEAK OF AROUND 140 KTS AND COAMPS-TC OF 115 KTS. THE STATISTICAL DYNAMICAL MODELS, AS WELL AS GFS, ALL DEPICT A PEAK INTENSITY OF AROUND 90 KTS. THE JTWC INTENSITY FORECAST CALLS FOR A PEAK OF 115 KTS, THOUGH THE ACTUAL PEAK INTENSITY OF 11W COULD BE EVEN HIGHER BEFORE LANDFALL IS MADE. AS A RESULT, THE JTWC INTENSITY FORECAST IS PLACED WITH MEDIUM CONFIDENCE THROUGH TAU 72 AND LOW THEREAFTER.
Rapid Intensification Guidance
Multiplatform Satellite Surface Wind Analysis (Experimental)
23/0830UTC DVORAK ANALYSIS
TPPN10 PGTW 230856
A. TROPICAL STORM 11W (SHANSHAN)
B. 23/0830Z
C. 18.41N
D. 140.87E
E. FIVE/GK2A
F. T4.0/4.0/D1.0/24HRS STT: S0.0/03HRS
G. IR/EIR/VIS/MSI
H. REMARKS: 40A/PBO SBC/ANMTN. LLCC EMBEDDED IN DG YIELDS A DT OF
4.0. MET AND PT AGREE. DBO DT.
I. ADDITIONAL POSITIONS: NONE
EL-NAZLY
A. TROPICAL STORM 11W (SHANSHAN)
B. 23/0830Z
C. 18.41N
D. 140.87E
E. FIVE/GK2A
F. T4.0/4.0/D1.0/24HRS STT: S0.0/03HRS
G. IR/EIR/VIS/MSI
H. REMARKS: 40A/PBO SBC/ANMTN. LLCC EMBEDDED IN DG YIELDS A DT OF
4.0. MET AND PT AGREE. DBO DT.
I. ADDITIONAL POSITIONS: NONE
EL-NAZLY
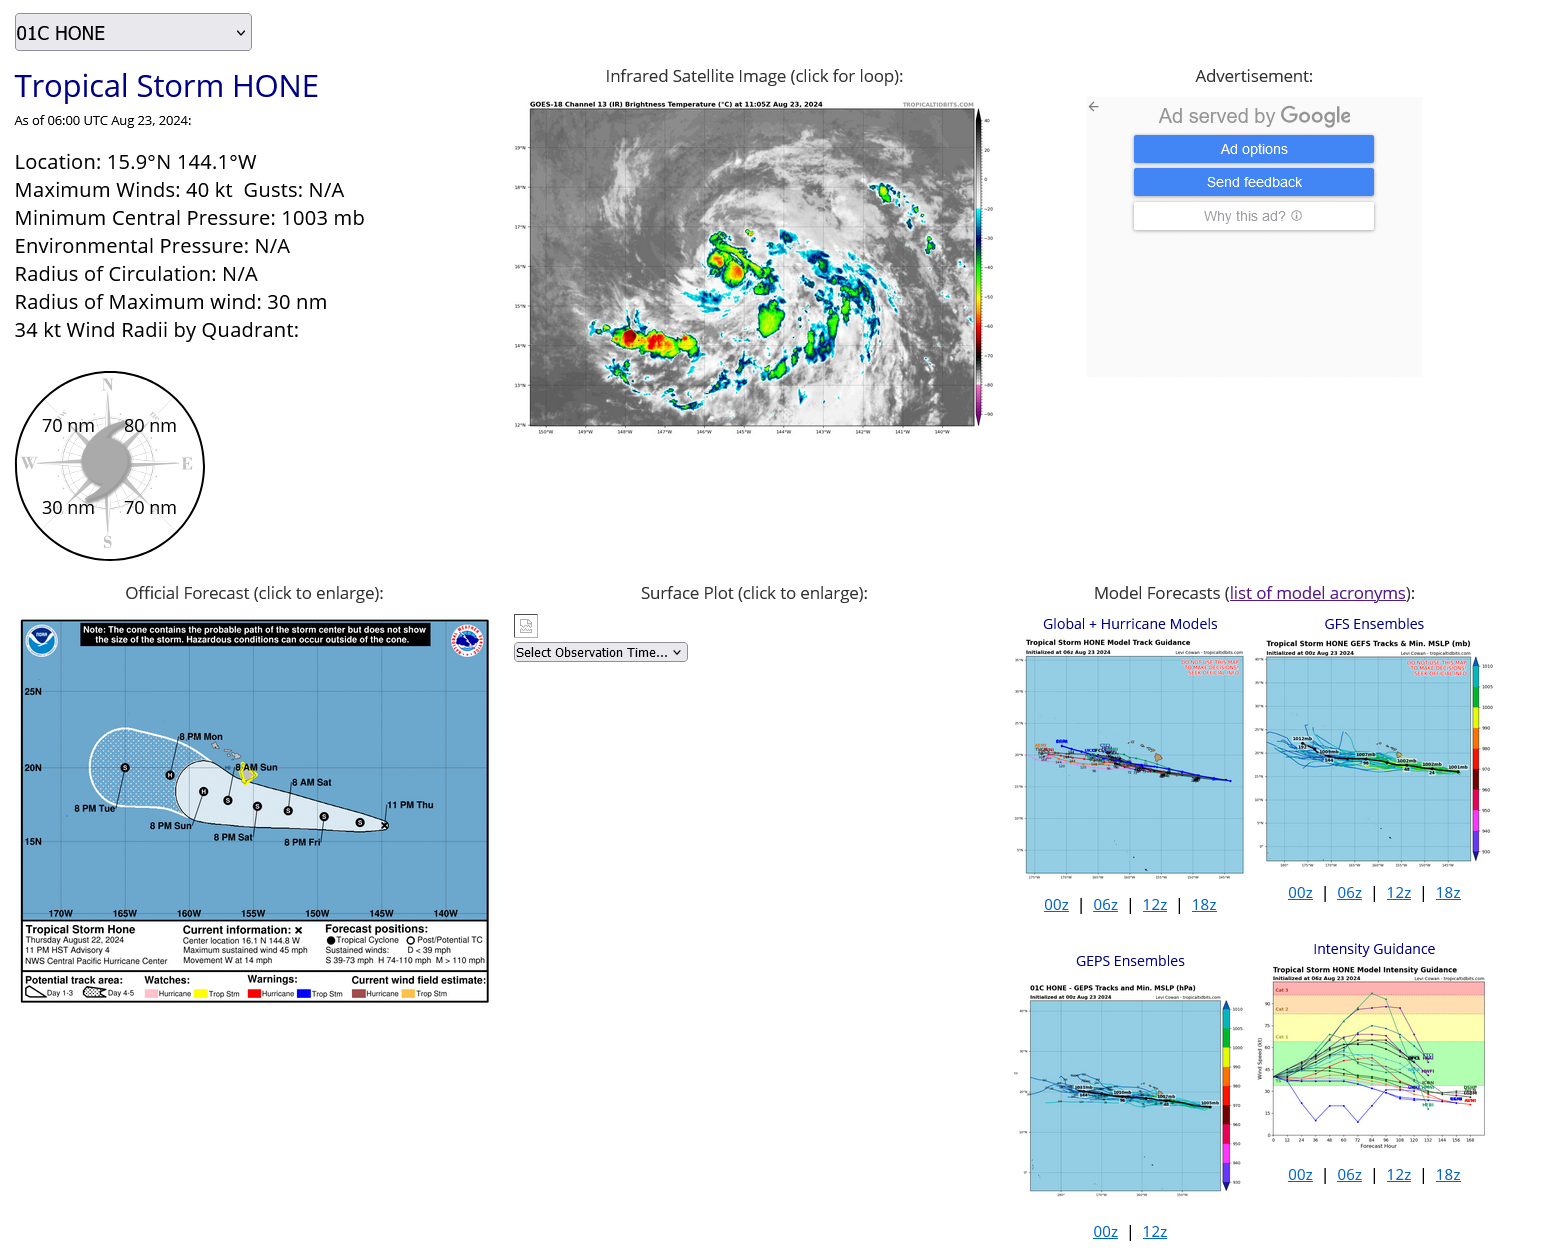
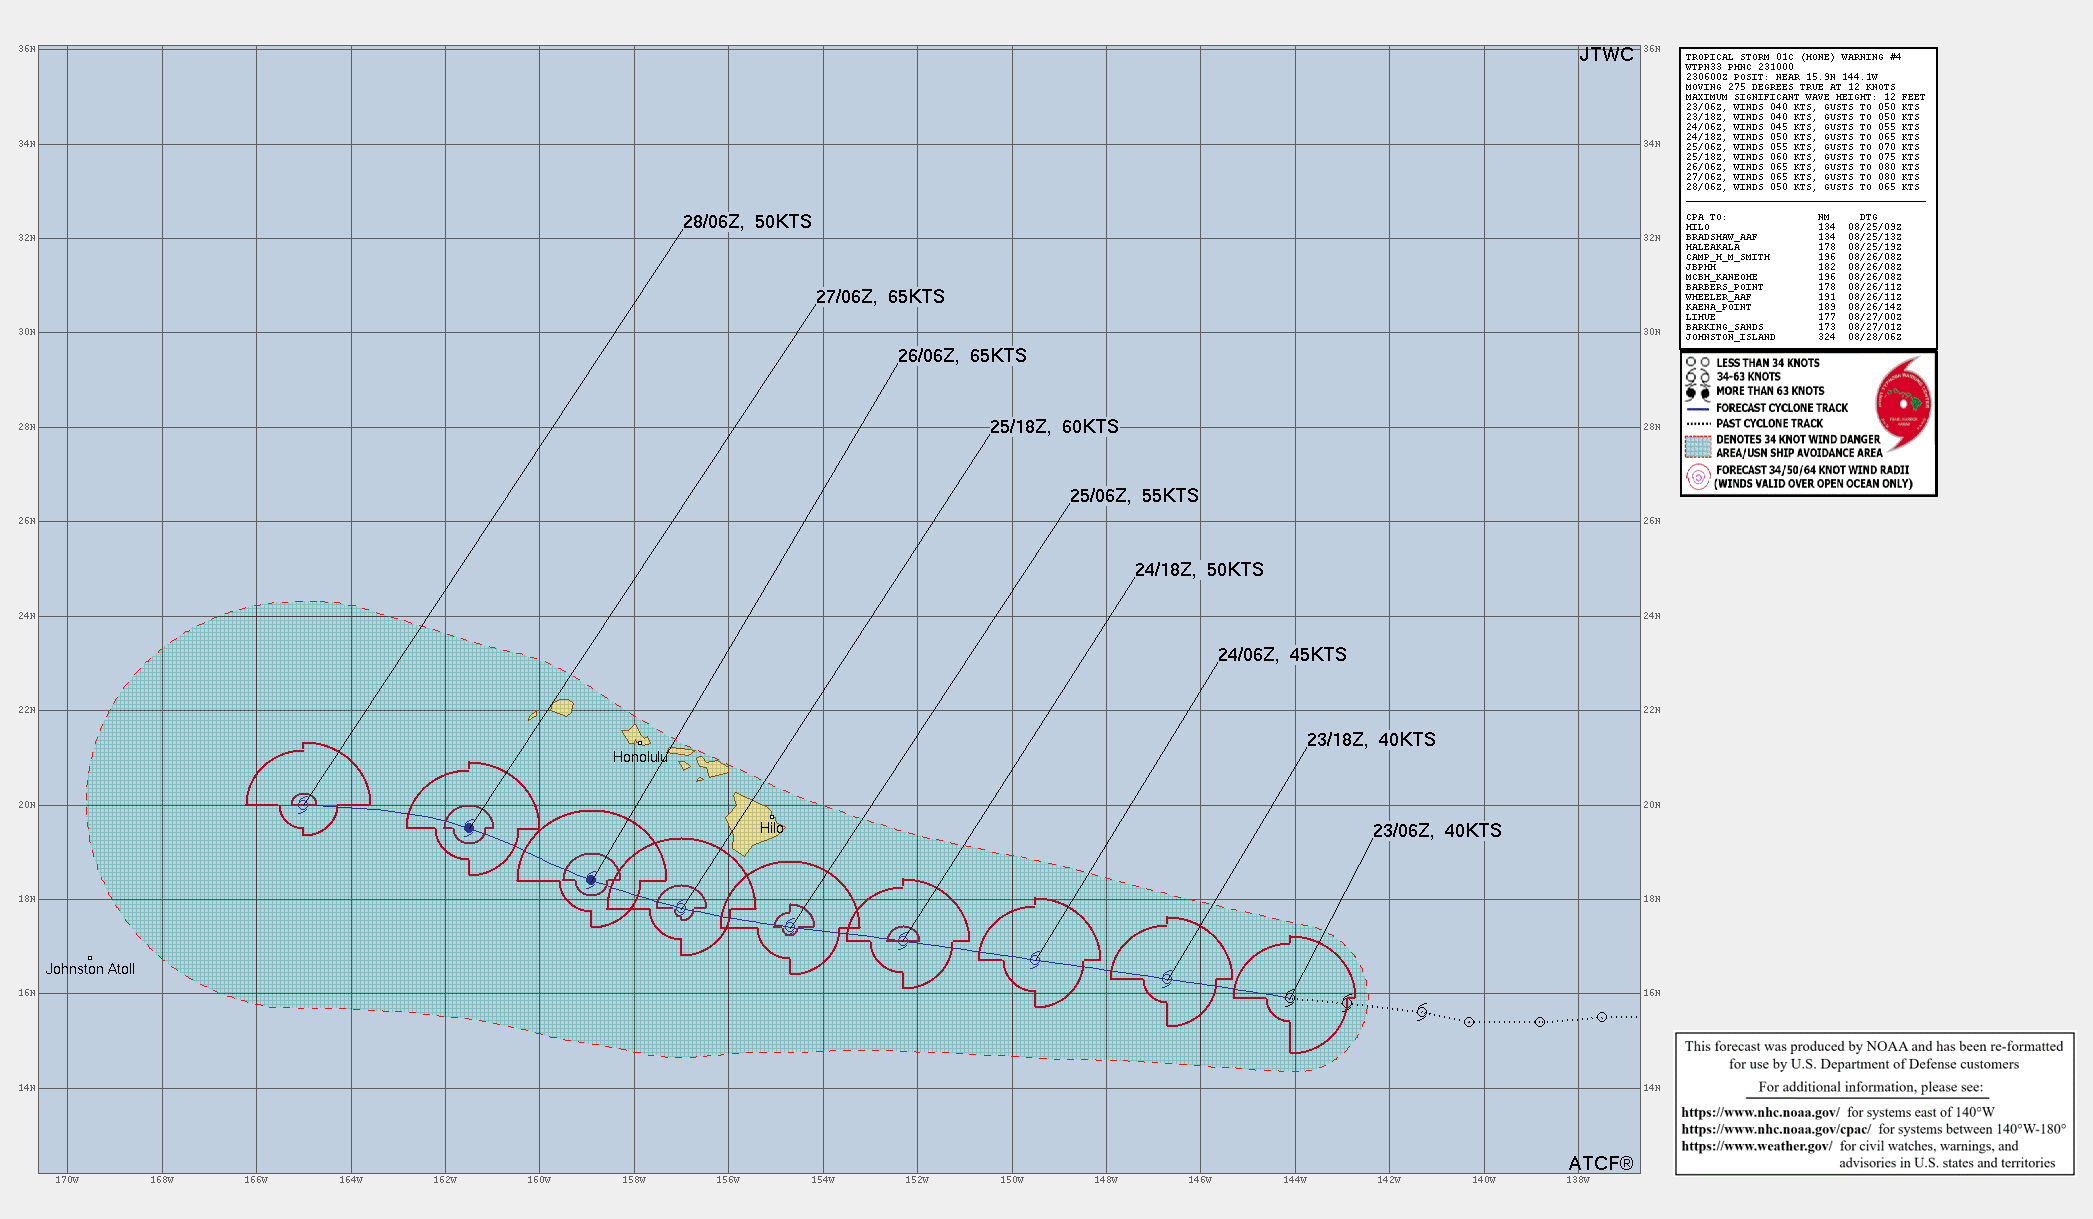
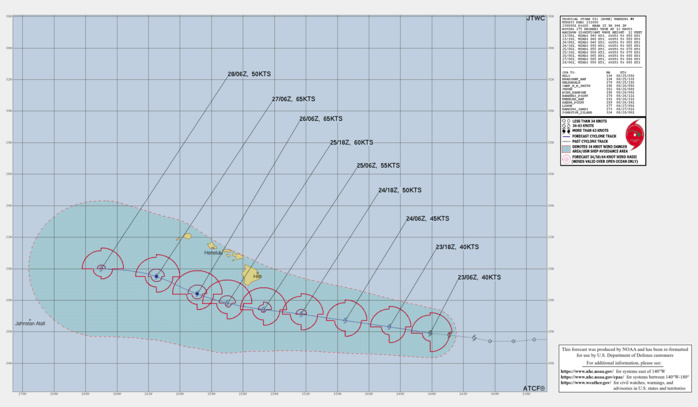
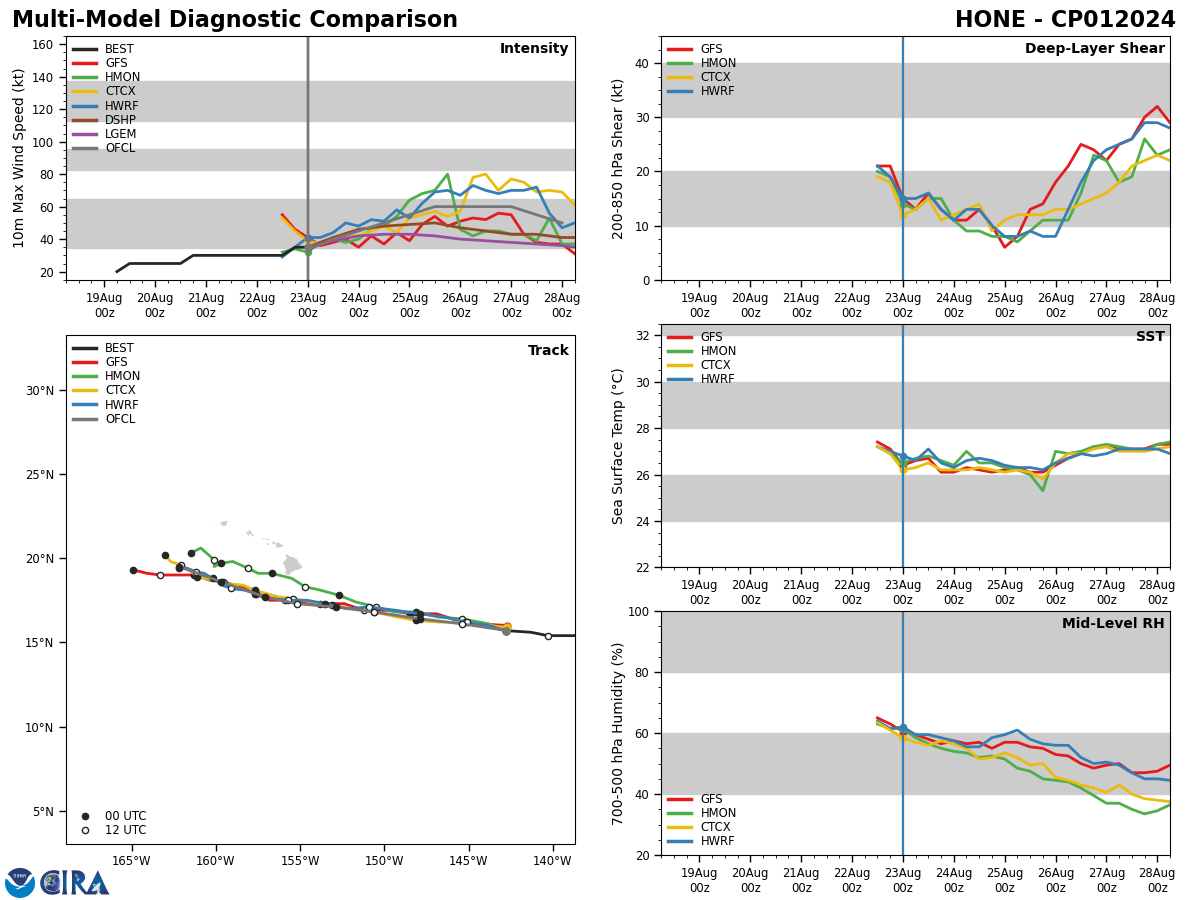
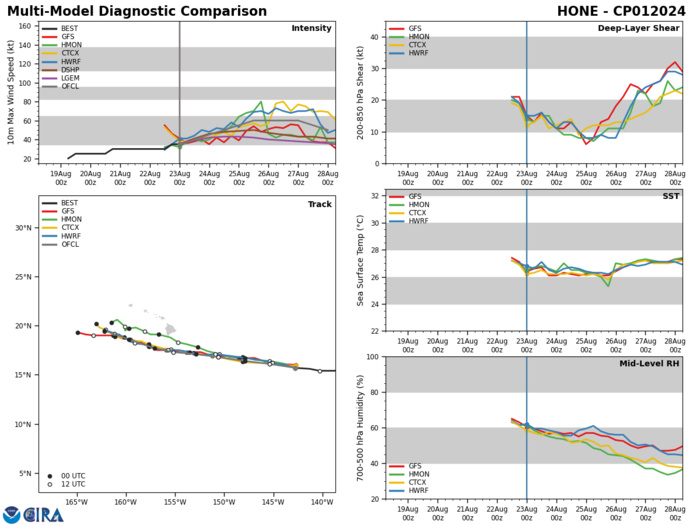
CENTRAL NORTH PACIFIC: TS 01C(HONE). 2306UTC ESTIMATED INTENSITY IS 40 KNOTS: + 10 KNOTS OVER 24 HOURS
0124081906 124N1306W 20
0124081912 127N1308W 25
0124081918 131N1311W 25
0124082000 134N1313W 25
0124082006 137N1317W 25
0124082012 139N1320W 25
0124082018 144N1325W 30
0124082100 147N1330W 30
0124082106 151N1338W 30
0124082112 154N1347W 30
0124082118 155N1360W 30
0124082200 155N1375W 30
0124082206 154N1388W 30
0124082212 154N1403W 30
0124082218 156N1413W 35
0124082300 158N1429W 35
0124082306 159N1441W 40
TC Warning Graphic
Model Diagnostic Plot
23/08UTC DVORAK ANALYSIS
TPPZ01 PGTW 230817
A. TROPICAL STORM 01C (HONE)
B. 23/0800Z
C. 15.86N
D. 144.30W
E. FIVE/GOES18
F. T2.0/2.0/D1.0/21HRS STT: S0.0/03HRS
G. IR/EIR
H. REMARKS: 38A/PBO SBC/ANMTN. CNVCTN WRAPS .3 ON LOG10 SPIRAL
YIELDING A DT OF 2.0. MET AND PT YIELD 1.5. DBO DT.
I. ADDITIONAL POSITIONS: NONE
EL-NAZLY
A. TROPICAL STORM 01C (HONE)
B. 23/0800Z
C. 15.86N
D. 144.30W
E. FIVE/GOES18
F. T2.0/2.0/D1.0/21HRS STT: S0.0/03HRS
G. IR/EIR
H. REMARKS: 38A/PBO SBC/ANMTN. CNVCTN WRAPS .3 ON LOG10 SPIRAL
YIELDING A DT OF 2.0. MET AND PT YIELD 1.5. DBO DT.
I. ADDITIONAL POSITIONS: NONE
EL-NAZLY
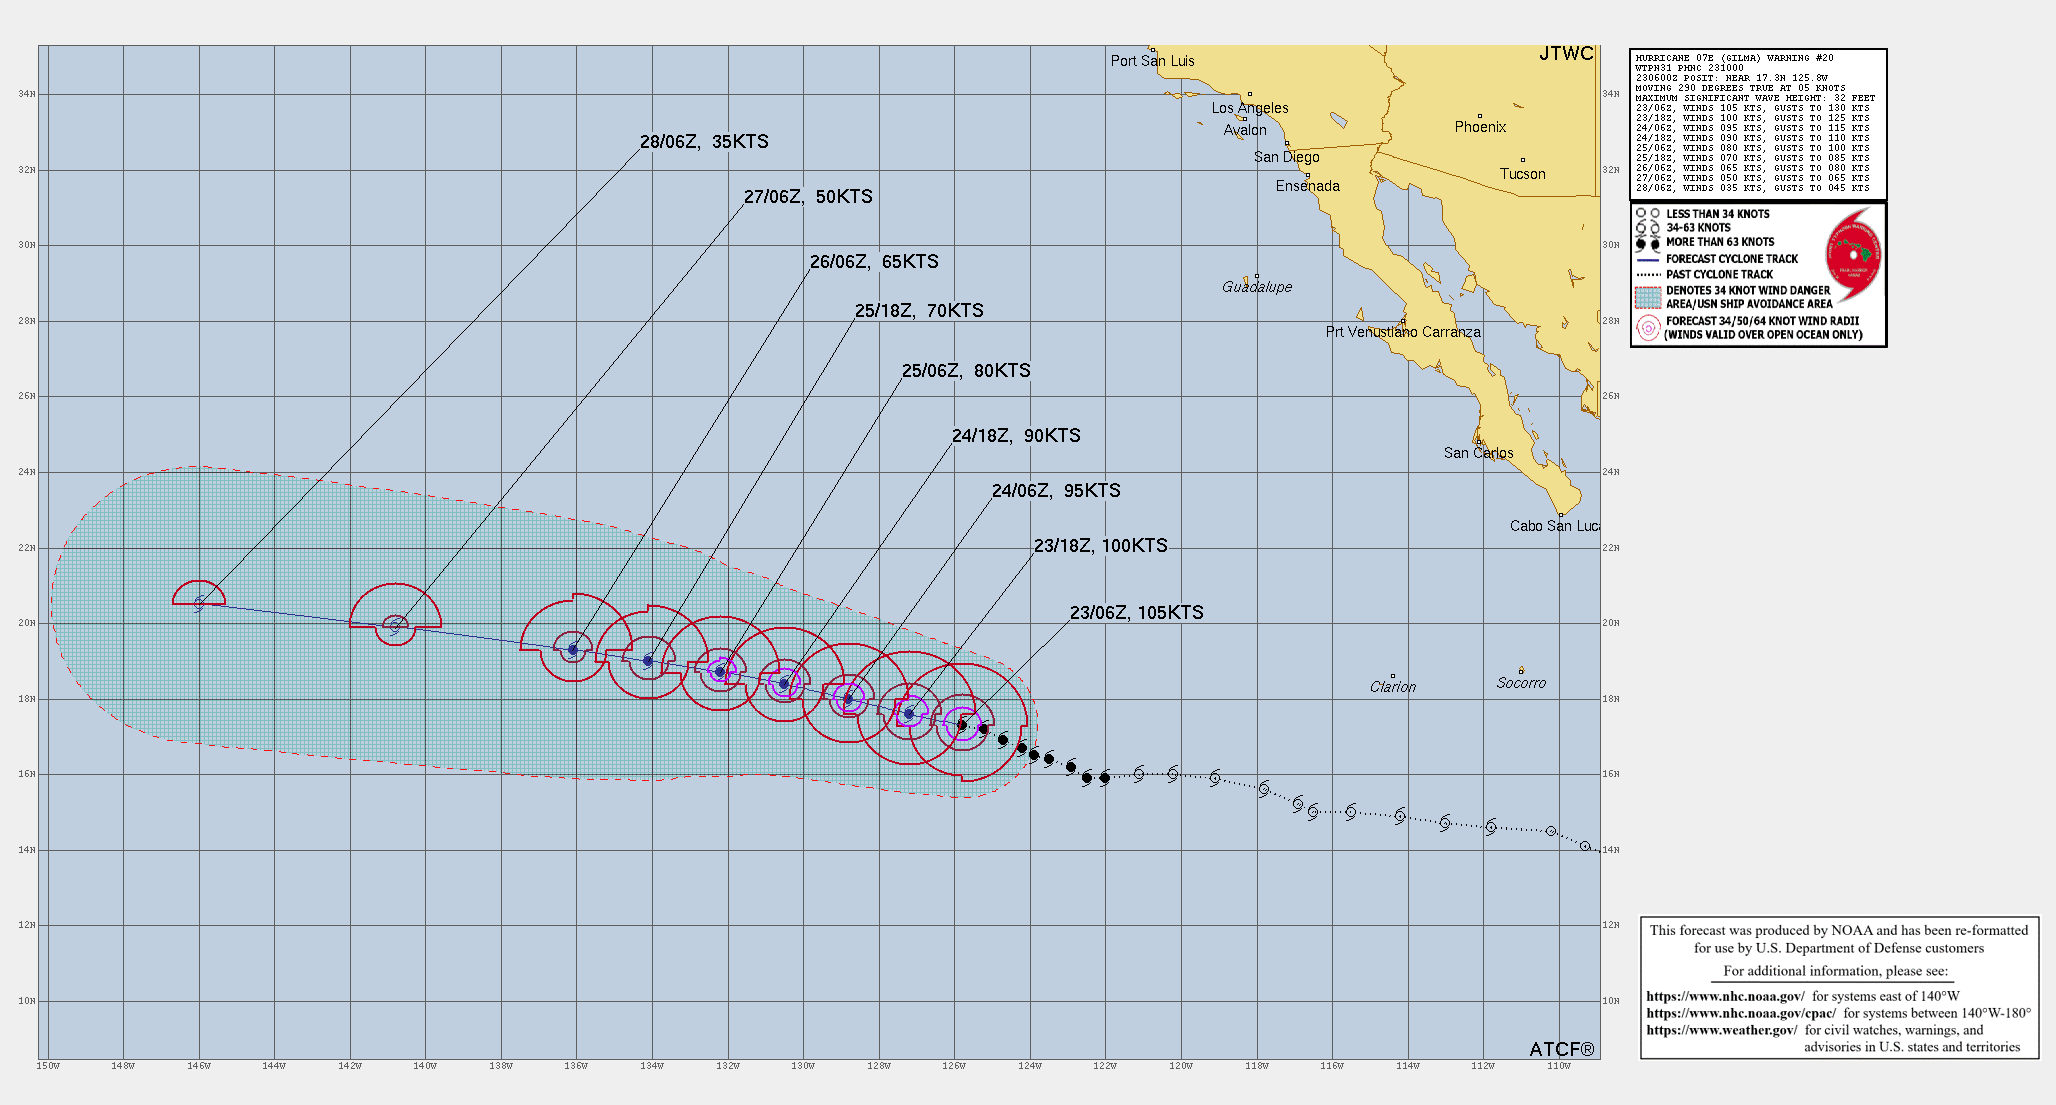
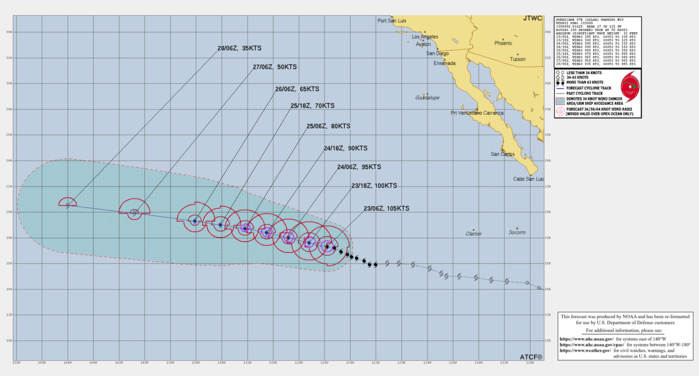
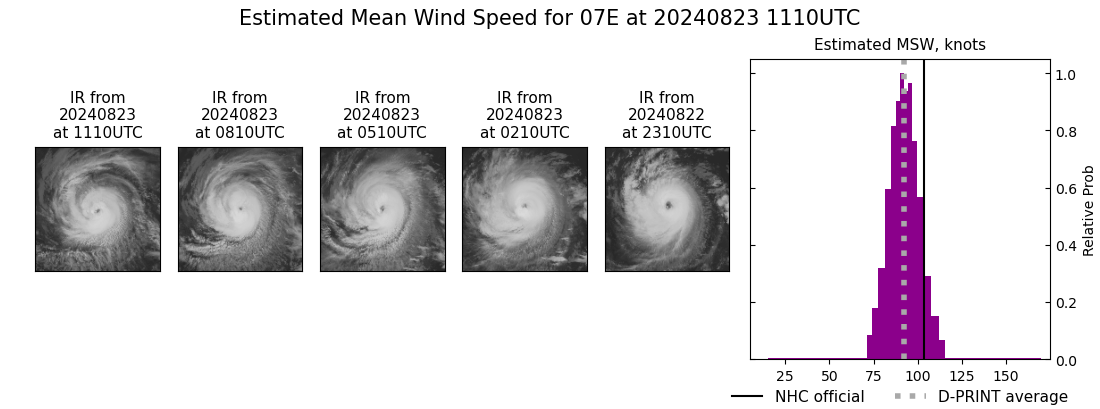
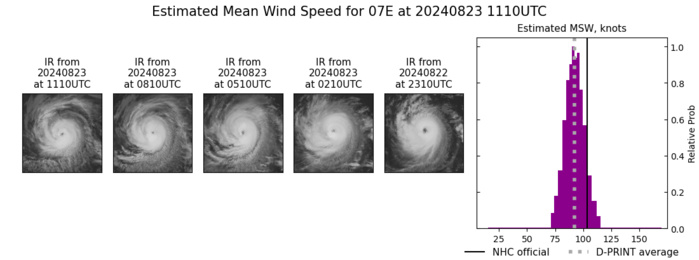
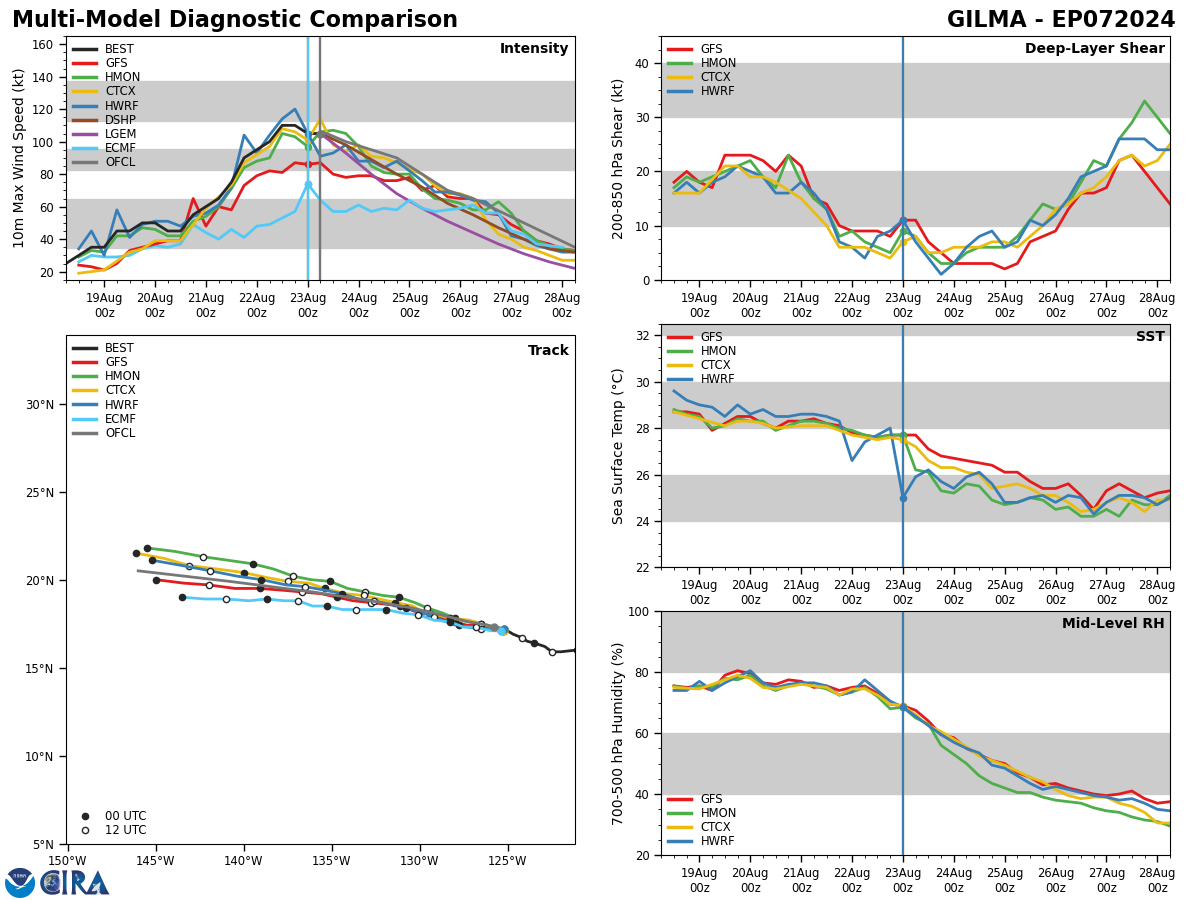
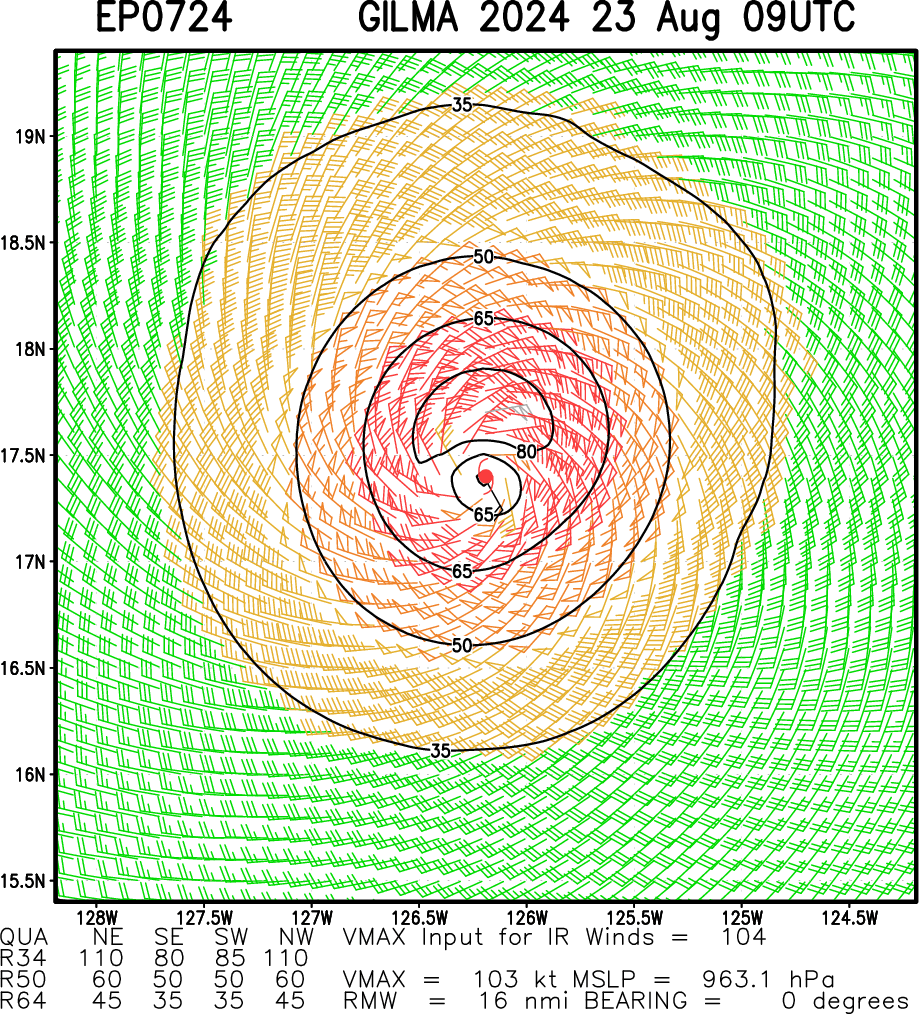
EASTERN NORTH PACIFIC: HU 07E(GILMA). 2306UTC ESTIMATED INTENSITY IS 105 KNOTS/CAT 3 US: + 5 KNOTS OVER 24 HOURS
0724081818 146N1118W 35
0724081900 147N1130W 35
0724081906 149N1142W 45
0724081912 150N1155W 45
0724081918 150N1165W 50
0724082000 152N1169W 50
0724082006 156N1178W 45
0724082012 159N1191W 45
0724082018 160N1202W 55
0724082100 160N1211W 60
0724082106 159N1220W 65
0724082112 159N1225W 75
0724082118 162N1229W 90
0724082200 164N1235W 95
0724082206 165N1239W 100
0724082212 167N1242W 110
0724082218 169N1247W 110
0724082300 172N1252W 105
0724082306 173N1258W 105
TC Warning Graphic
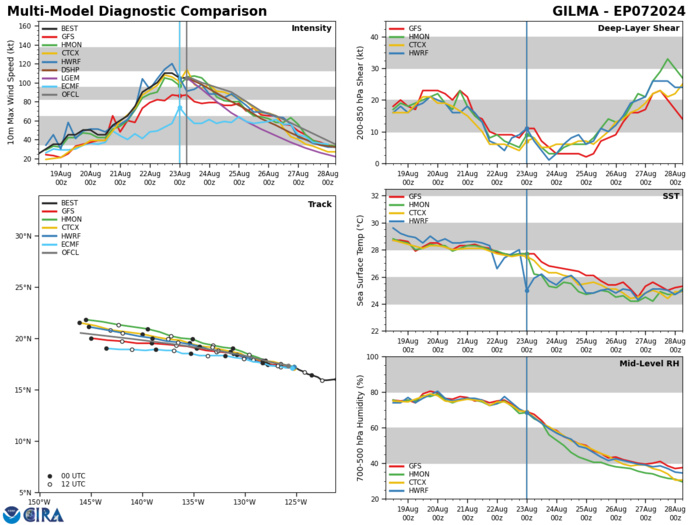
Model Diagnostic Plot
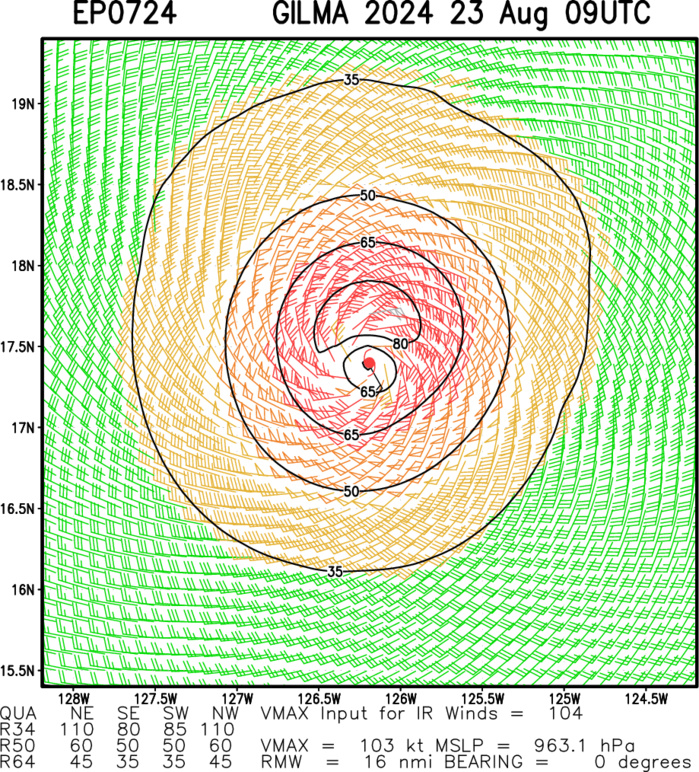
Multiplatform Satellite Surface Wind Analysis (Experimental)
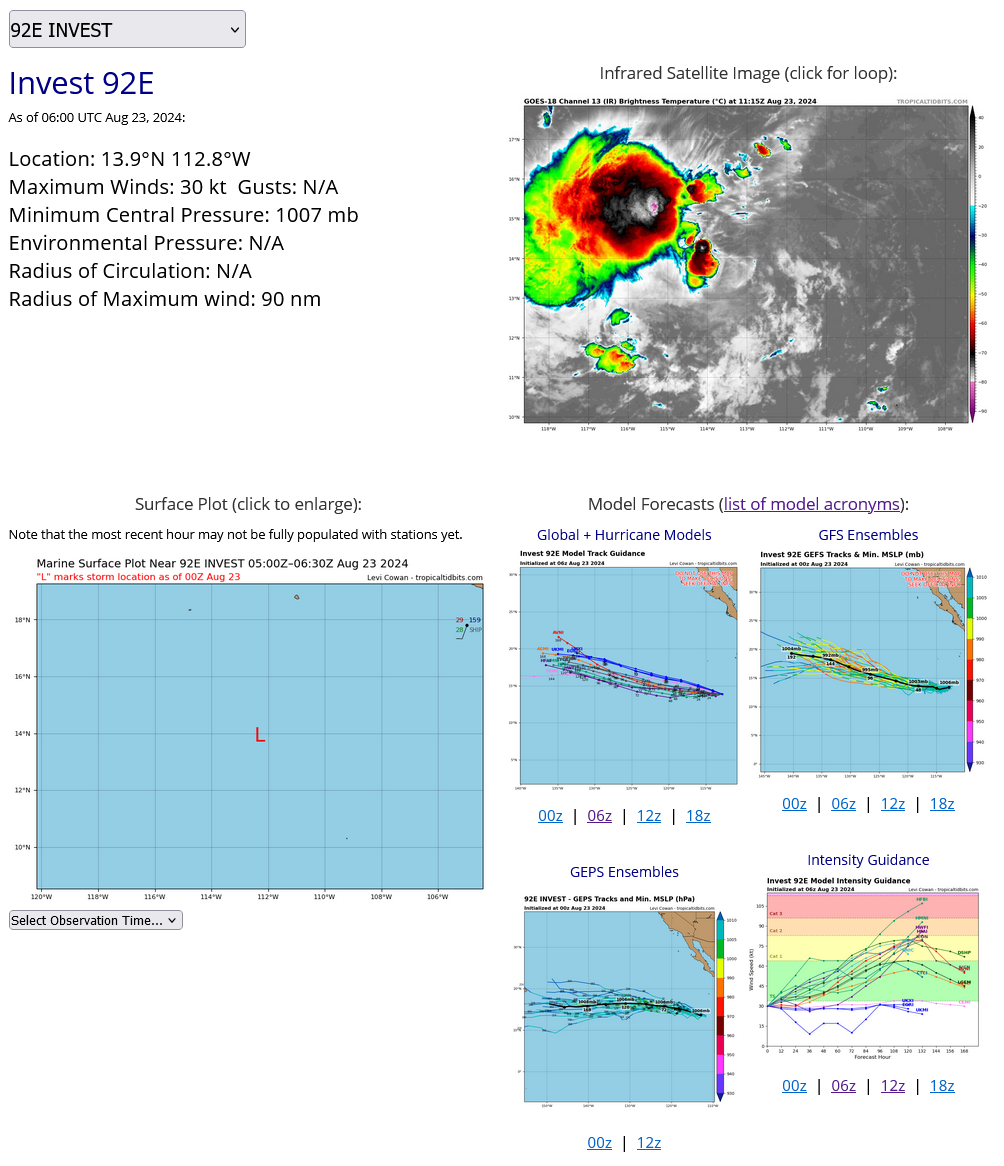
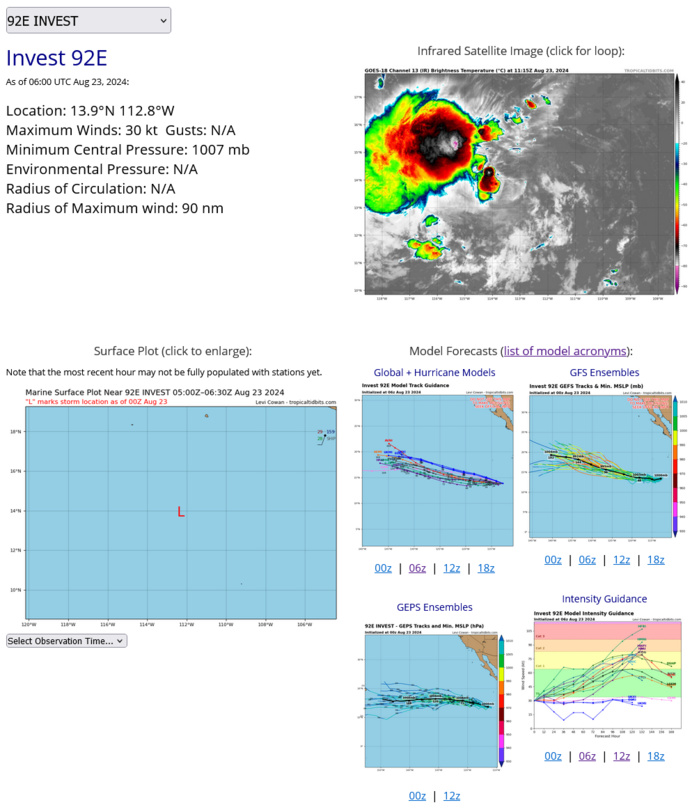
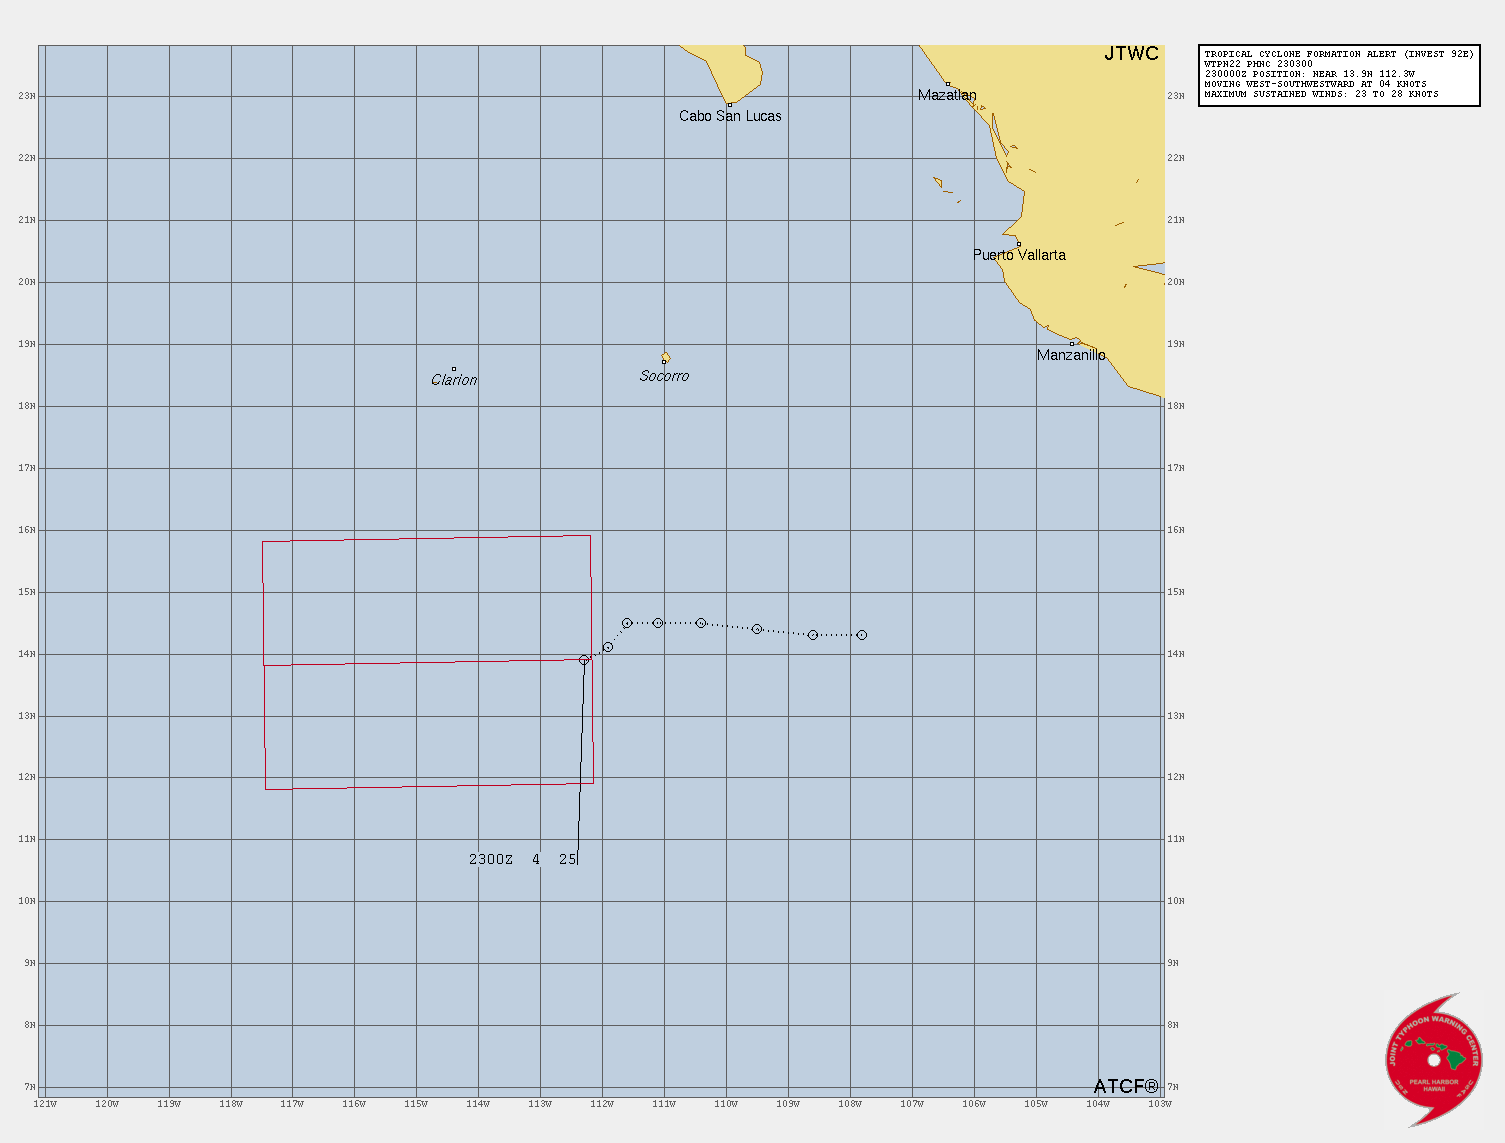
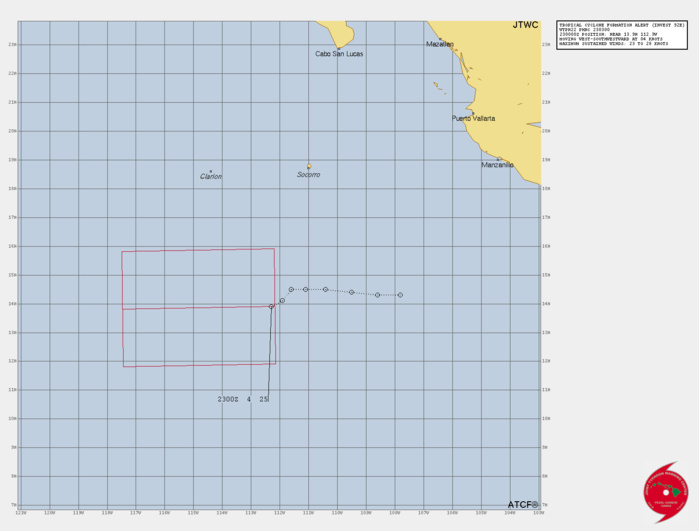
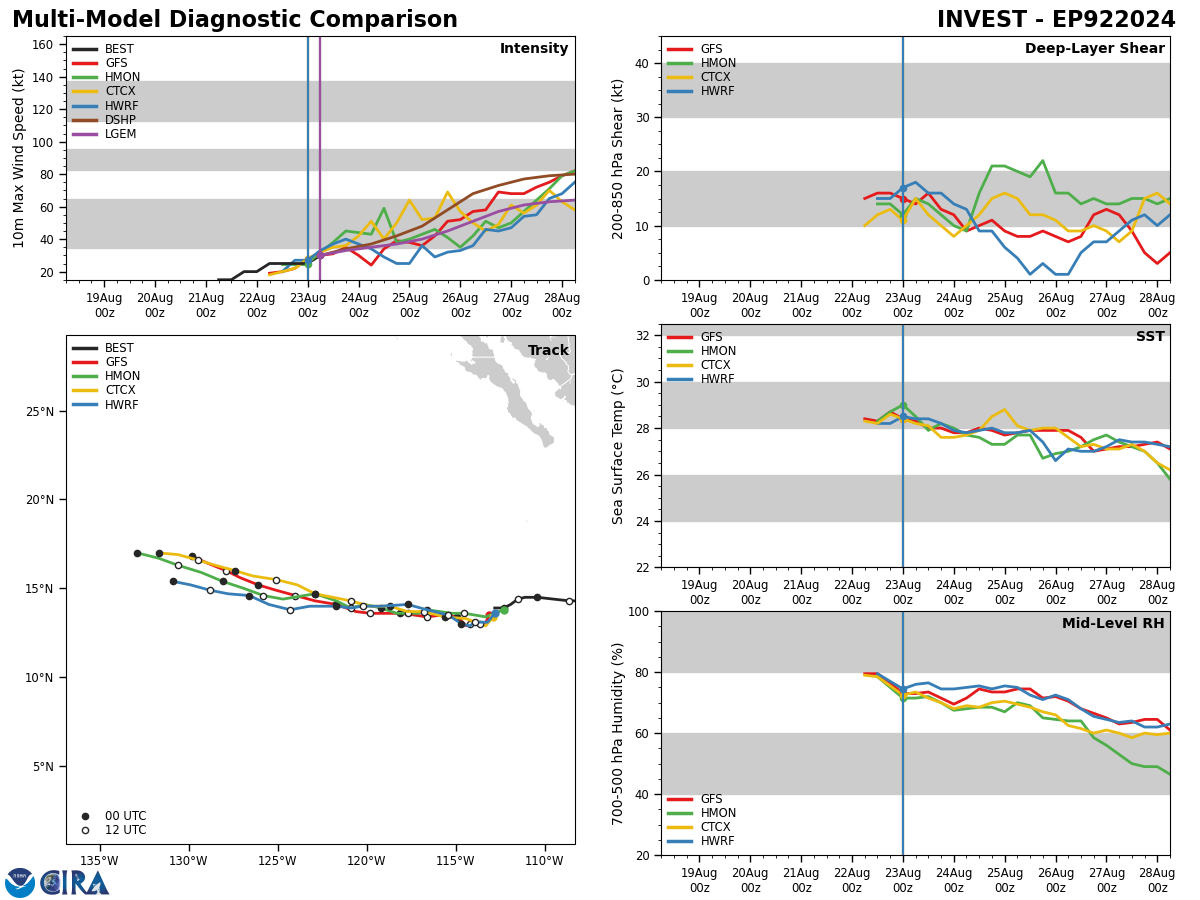
EASTERN NORTH PACIFIC: INVEST 92E. 2306UTC ESTIMATED LOCATION AND INTENSITY
TROPICAL CYCLONE FORMATION ALERT ISSUED AT 2302UTC.
Model Diagnostic Plot
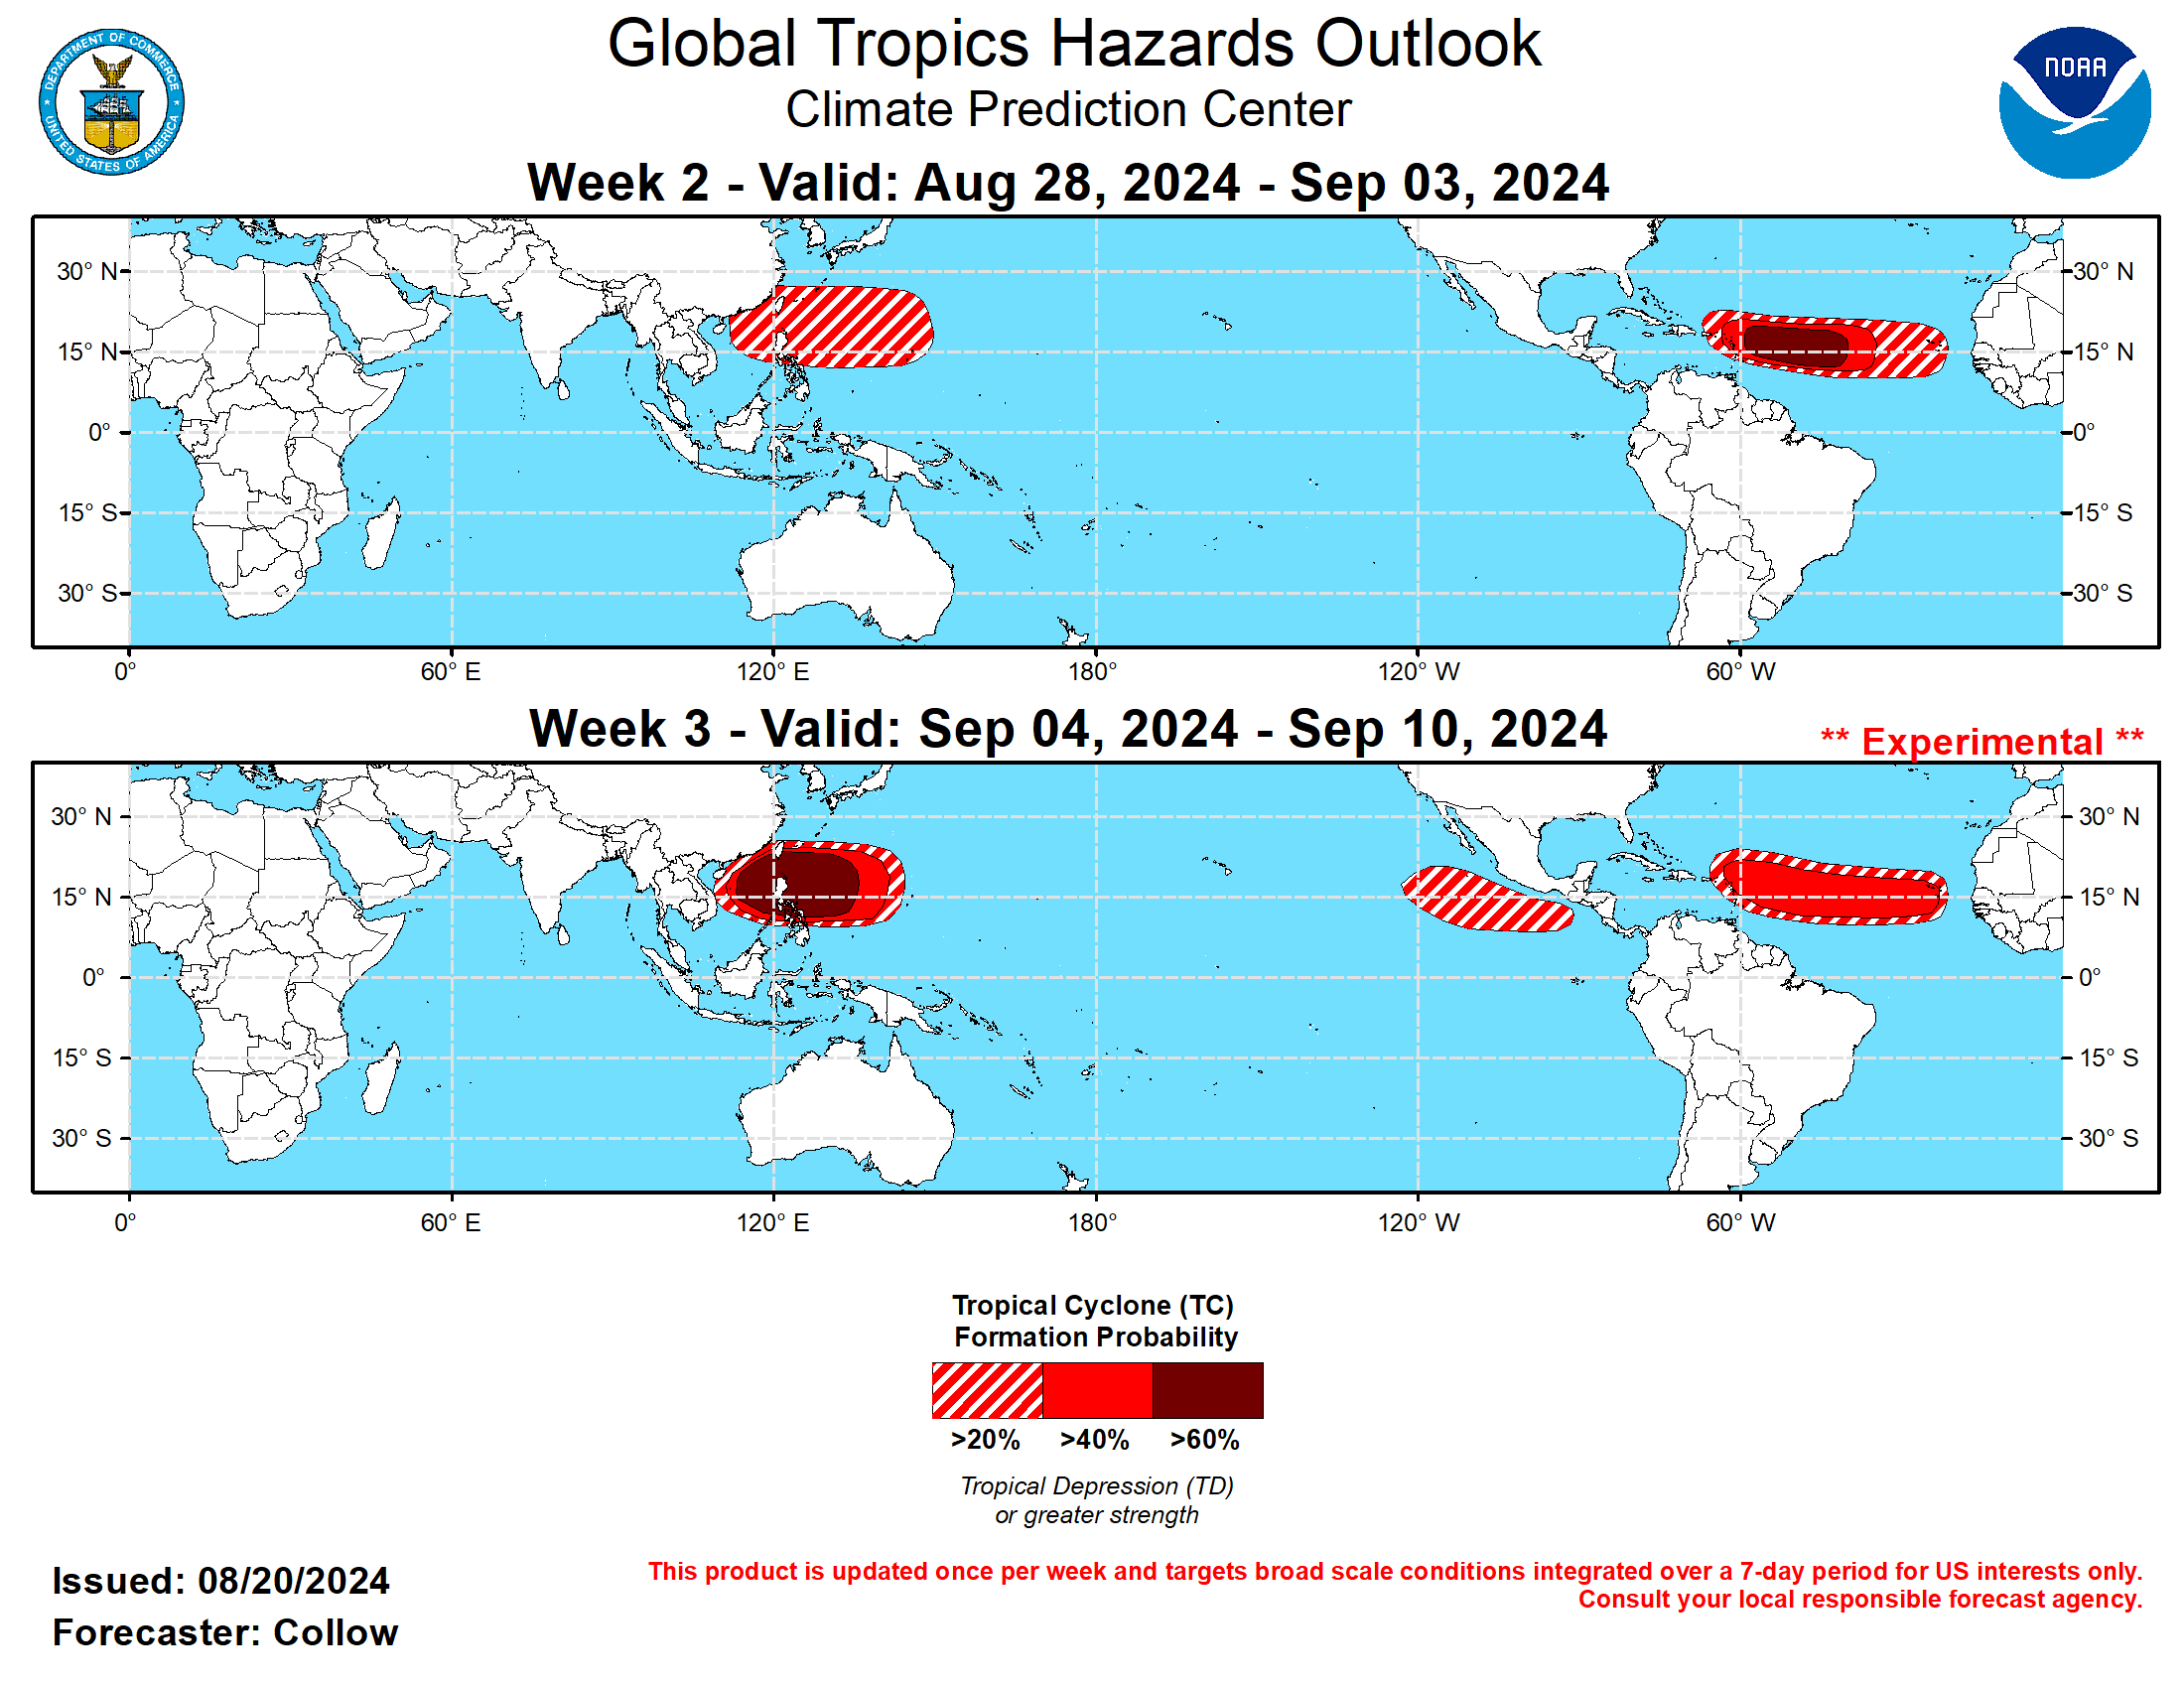
Last Updated - 08/20/24 3 WEEK TROPICAL CYCLONE FORMATION PROBABILITY
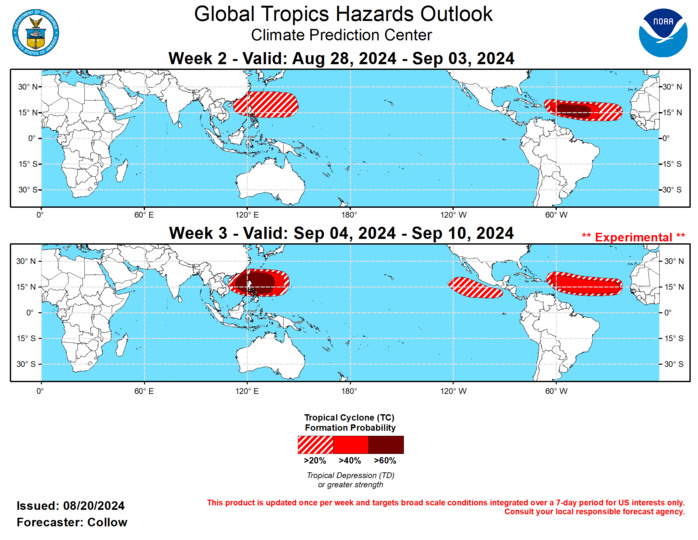
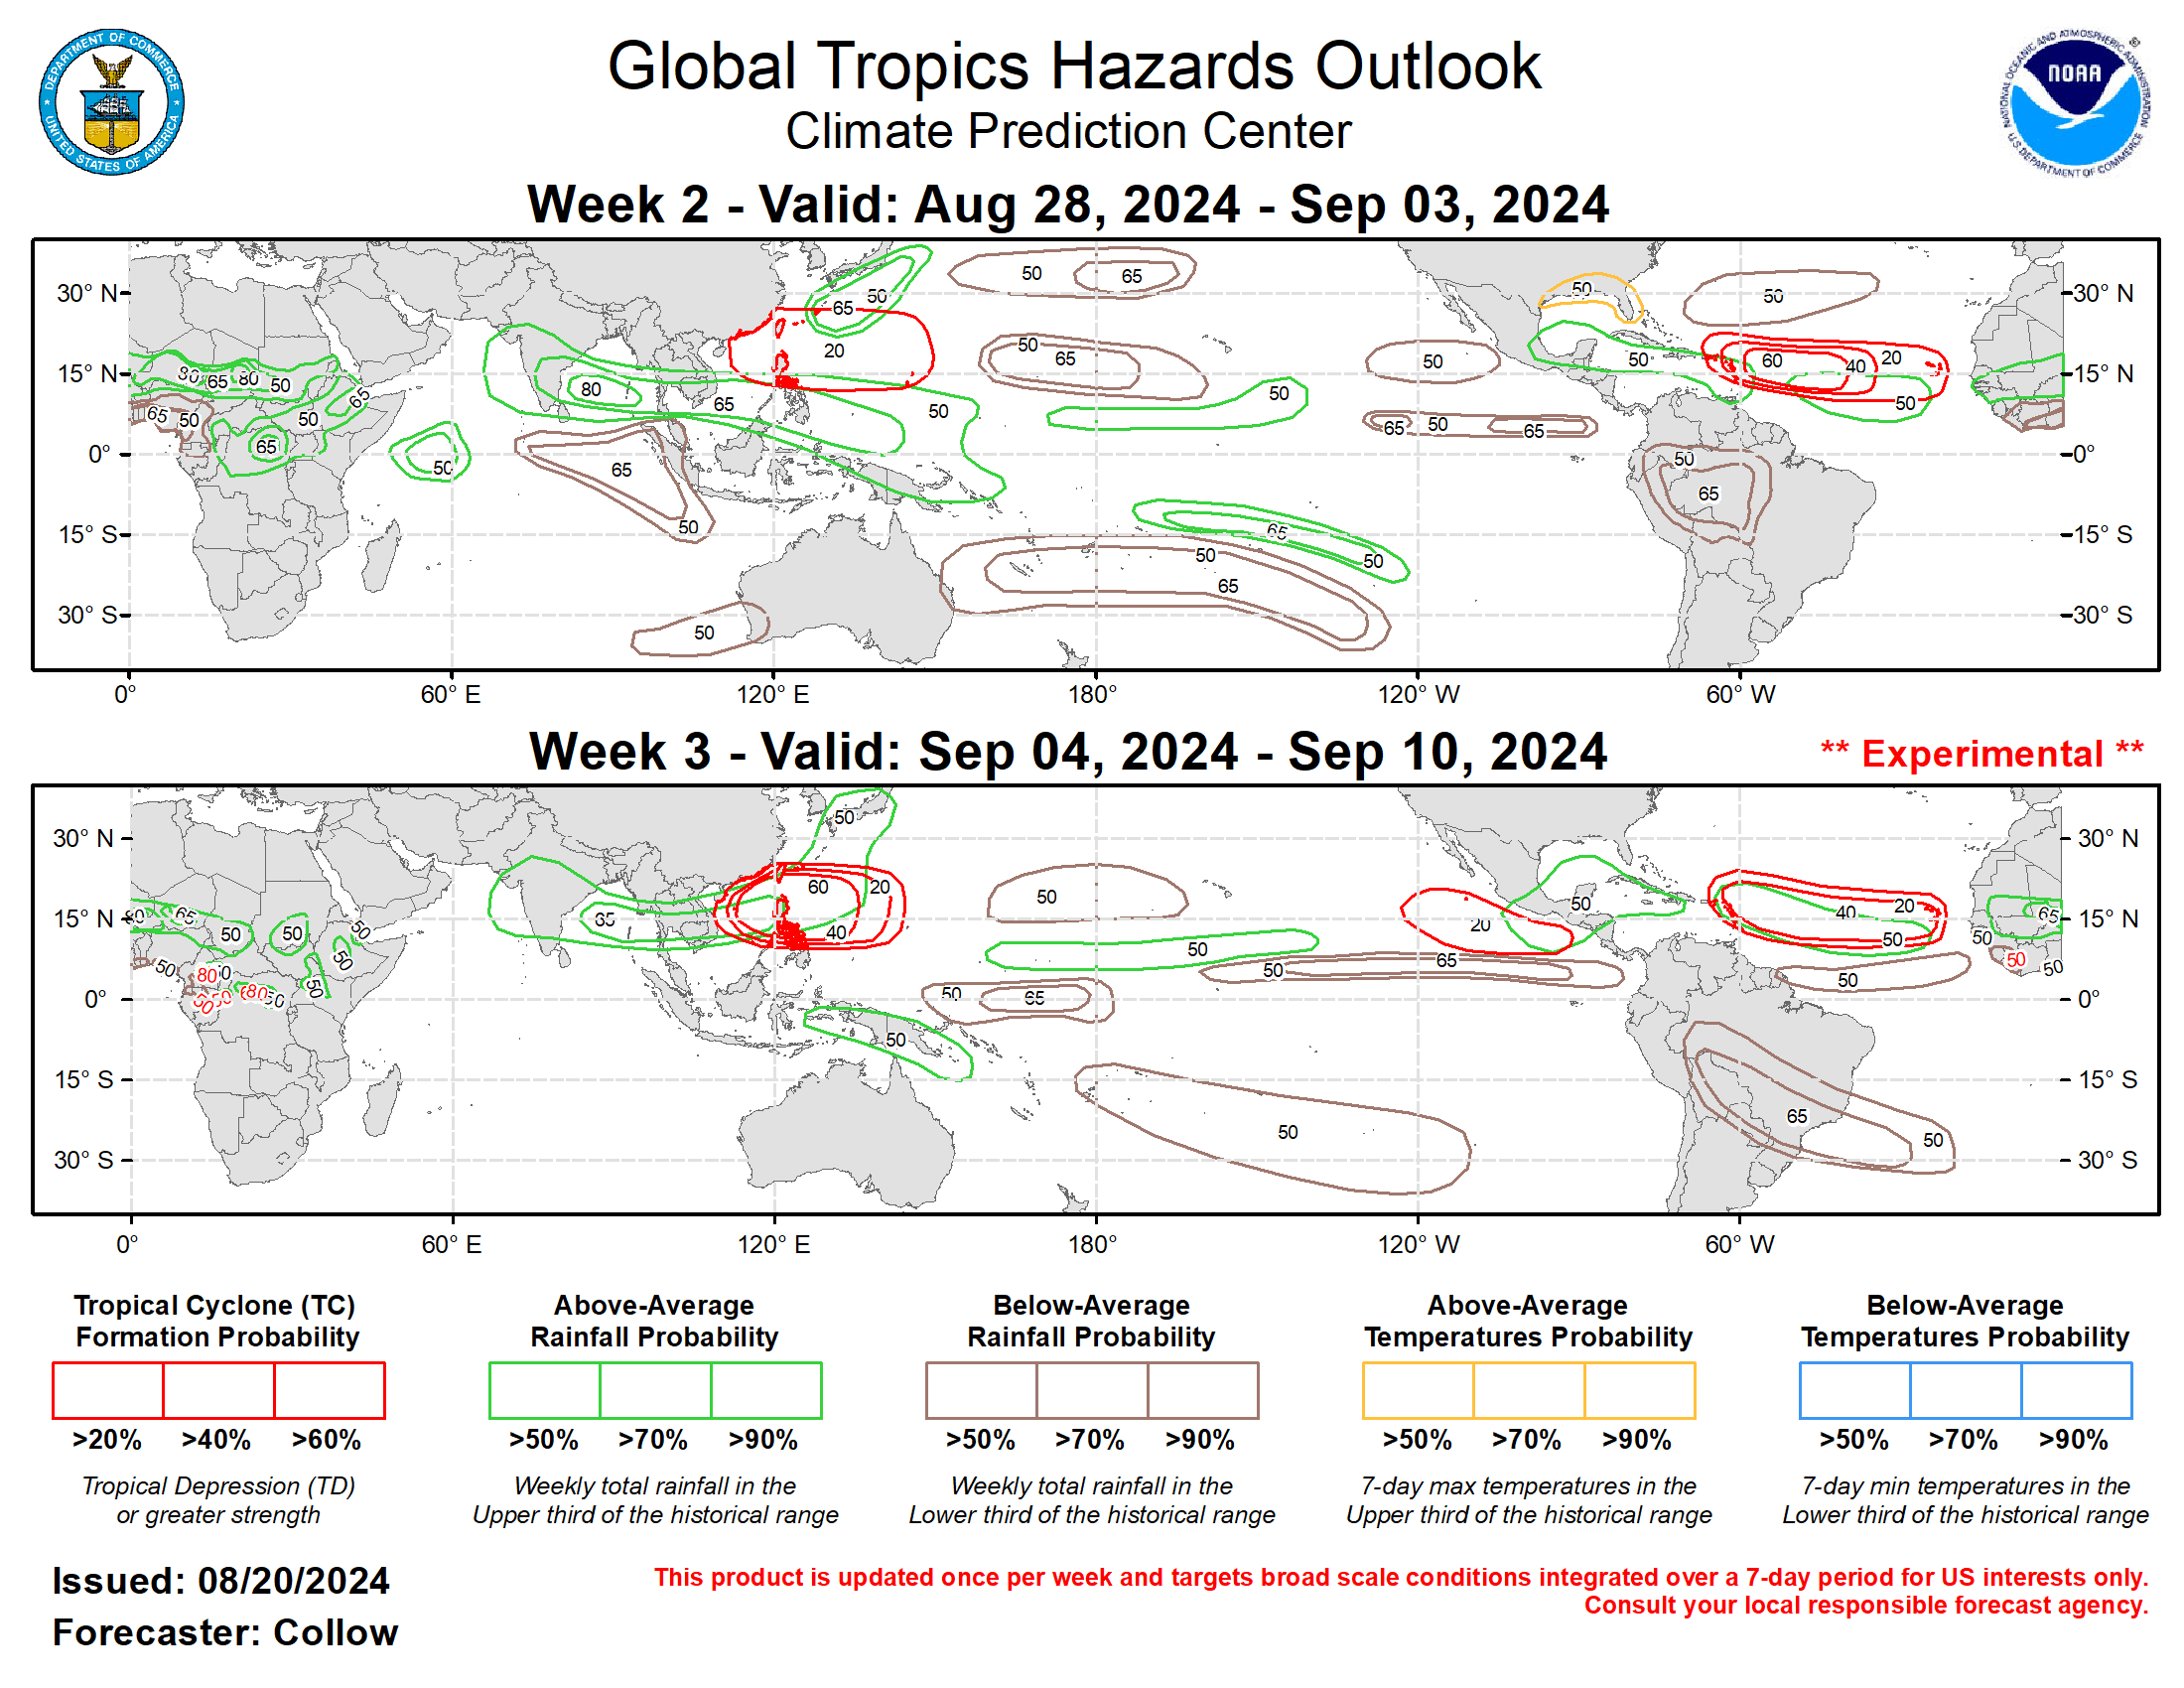
GTH Outlook Discussion Last Updated - 08/20/24 Valid - 08/28/24 - 09/10/24 The Madden Julian Oscillation (MJO) has increased in amplitude over the Indian Ocean (border of RMM phases 2 and 3) during the past week, aided by constructive interference with enhanced Equatorial Rossby Wave activity. Temporary weakening of the MJO is possible in the near-term due to destructive interference with the suppressed phase of a Rossby Wave, although most dynamical models indicate a resurgent MJO moving across the Maritime Continent by the end of week-2. The ECMWF and BOMM ensembles are the most robust, showing a clear propagation of the intraseasonal signal into RMM phase 5 by early September, with the GEFS having more variability among its ensemble members. There is also a well-defined wave-1 asymmetry in the global upper-level velocity potential pattern, with enhanced divergence (convergence) aloft across Europe, Africa, and the Indian Ocean (Pacific and the Americas) consistent with the MJO placement. Objective filtering of the upper-level velocity potential anomalies between 5 deg S and 5 deg N indicate an eastward propagating MJO signal into the Maritime Continent, with a slowing over the far Western Pacific during week-3. The global tropics continued to be active in the past week. Across the Western Pacific, Tropical Storm Jongdari formed on 8/19. This system has since weakened to a depression with its remnants tracking toward Korea. Additional development is possible in the vicinity of the Mariana Islands later this week. While low-end tropical cyclone formation chances (20-40 percent) remain forecast for week-2 given the persistent pattern and climatology, the eastward propagating MJO toward the region greatly increases chances for TC development during week-3, with a 60 percent chance or greater area extending from the South China Sea to east of the Philippines (135 deg E). A Convectively Coupled Kelvin Wave (CCKW) moving eastward across the basin and destructively interfering with the suppressed phase of the MJO had led to an uptick in TC activity across the Eastern Pacific. Tropical Storm Gilma formed on 8/18 and is forecast to strengthen into a hurricane and track west-northwestward over open waters. The National Hurricane Center is monitoring two additional disturbances for potential development in the next week. The first (90 percent chance) is forecast to cross into the Central Pacific Basin and track close to Hawaii in the coming days. Another system over the Eastern Pacific (east of Gilma) is given a 50 percent chance of TC development in the next week. The Eastern Pacific is forecast to quiet down during week-2 given the suppressed convective environment aloft and the departing CCKW. However, dynamical models indicate a renewed ramp up in activity toward week-3, supporting 20-40 percent chances for TC development during this time frame. In the wake of Hurricane Ernesto, the Atlantic Basin is quiet. A stalled frontal boundary over the northern Gulf of Mexico may lead to surface low development later this week, with the 0z deterministic ECMWF indicating a circulation moving along the Gulf Coast. It is highly uncertain whether or not a TC could come out of this, but not improbable. The MJO propagation across the Indian Ocean supports an increase in African easterly wave activity with one or more disturbances forecast to exit the coast of Africa beginning around the end of August and continuing into September. Models have been rather meager in terms of TC formation probabilities, however, the aforementioned uptick in easterly wave activity combined with anomalously warm sea surface temperatures, near peak season climatology, a projected reduction in Saharan dust, and the aforementioned CCKW shifting from the Pacific to the Atlantic support having at least a 60 percent chance of tropical cyclone development during week-2 over the western portion of the Main Development Region, with higher wind shear lowering chances further east. Chances diminish somewhat by week-3 (40-60 percent chance) given an expected tapering of the easterly waves as the MJO shifts further eastward, although wind shear may become less of an inhibiting factor. TC development over the northwestern Caribbean or Gulf of Mexico is also not out of the question later in week-2 or week-3, but confidence is too low to include a formation region, with only the GEFS indicating an elevated signal at this time.
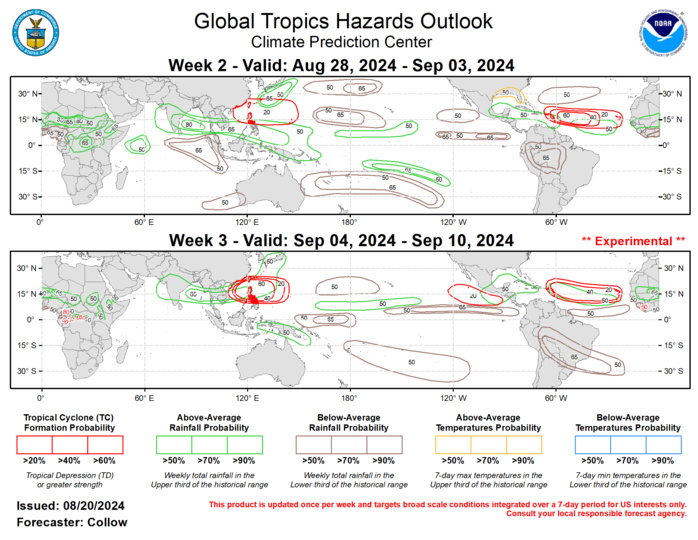
Forecasts for enhanced and suppressed precipitation for weeks 2 and 3 are based on historical composites of Indian Ocean and Maritime Continent MJO events, anticipated TC tracks, and a skill weighted consensus of the CFS, GEFS, ECMWF, and ECCC model systems, with some consideration of ENSO cold phase composites. Increased chances for above-normal temperatures are forecast for the southeastern CONUS during week-2. For hazardous weather conditions in your area during the next two weeks, please refer to your local NWS office, the Medium Range Hazards Forecast from the Weather Prediction Center (WPC), and the CPC Week-2 Hazards Outlook. Forecasts issues over Africa are made in coordination with the Africa Desk at CPC.
