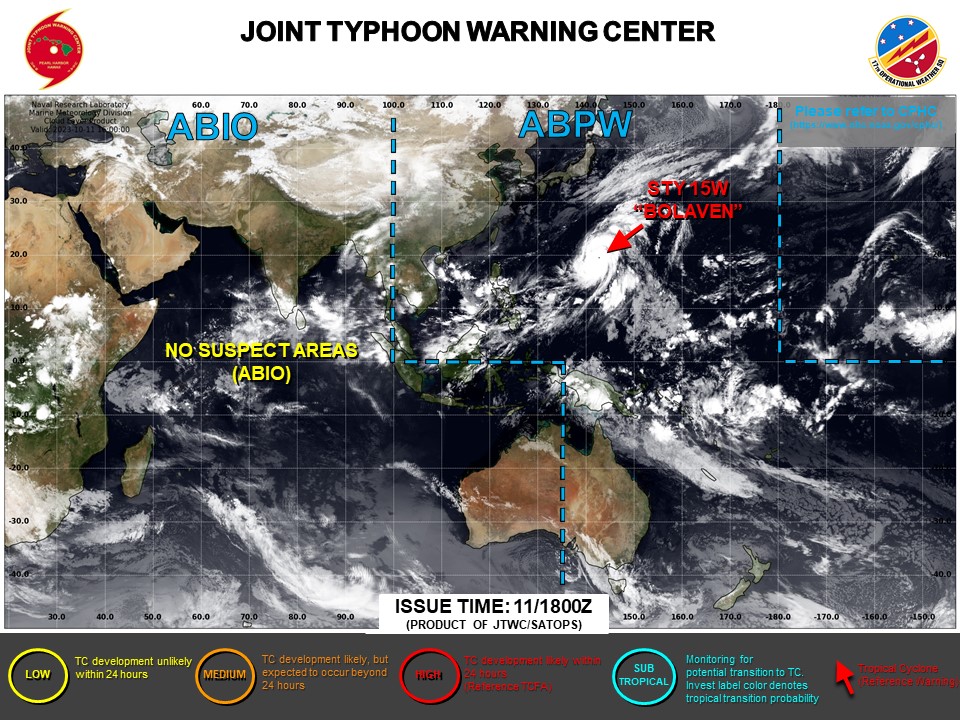
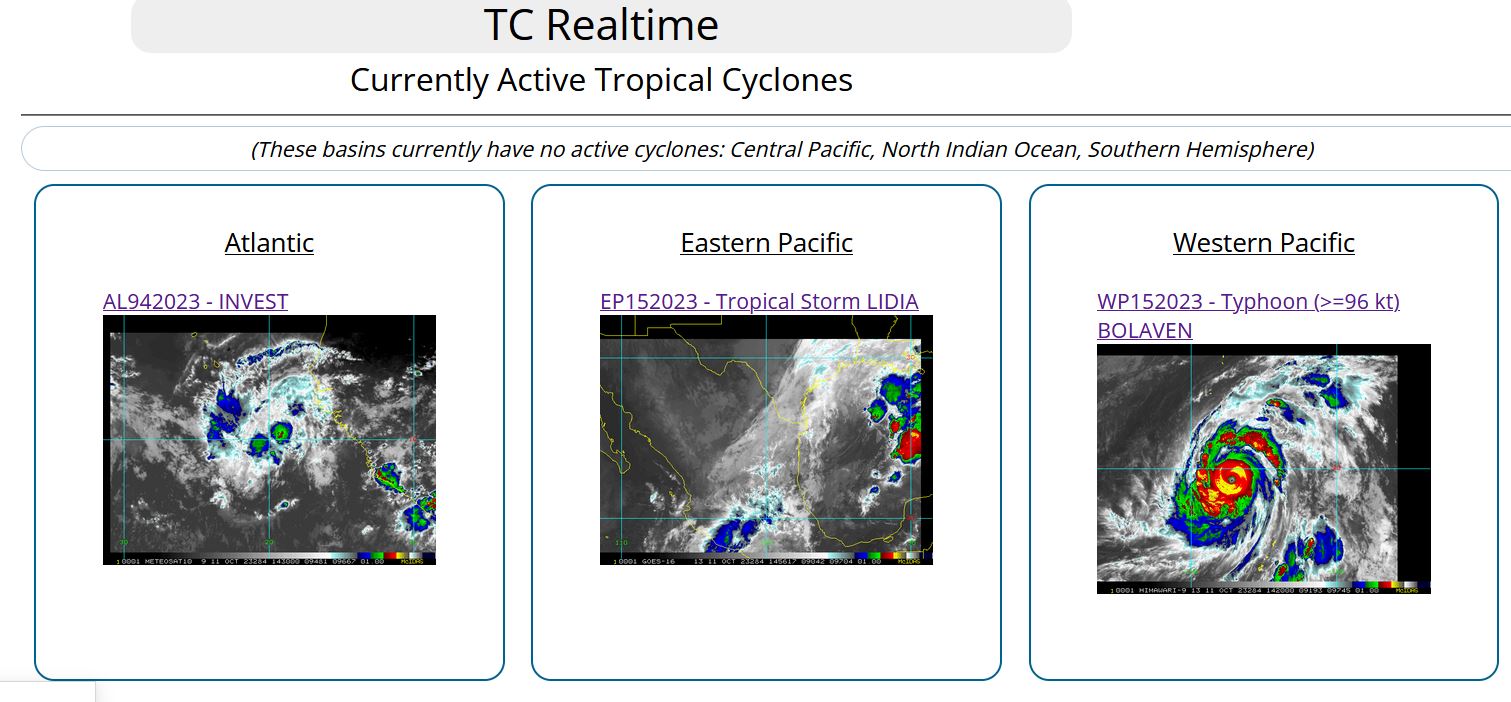
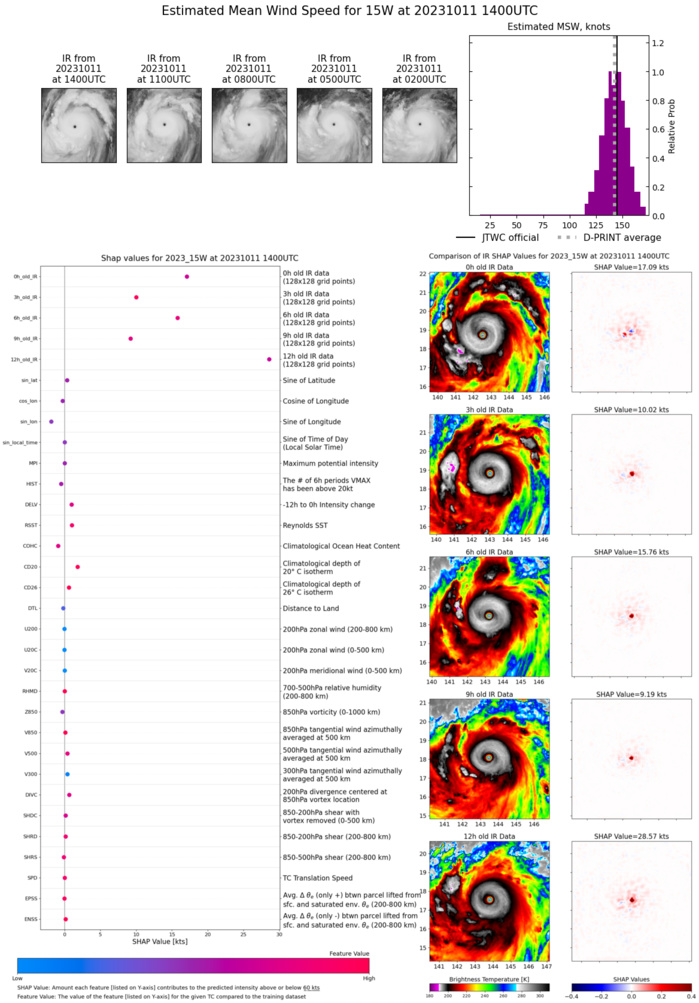
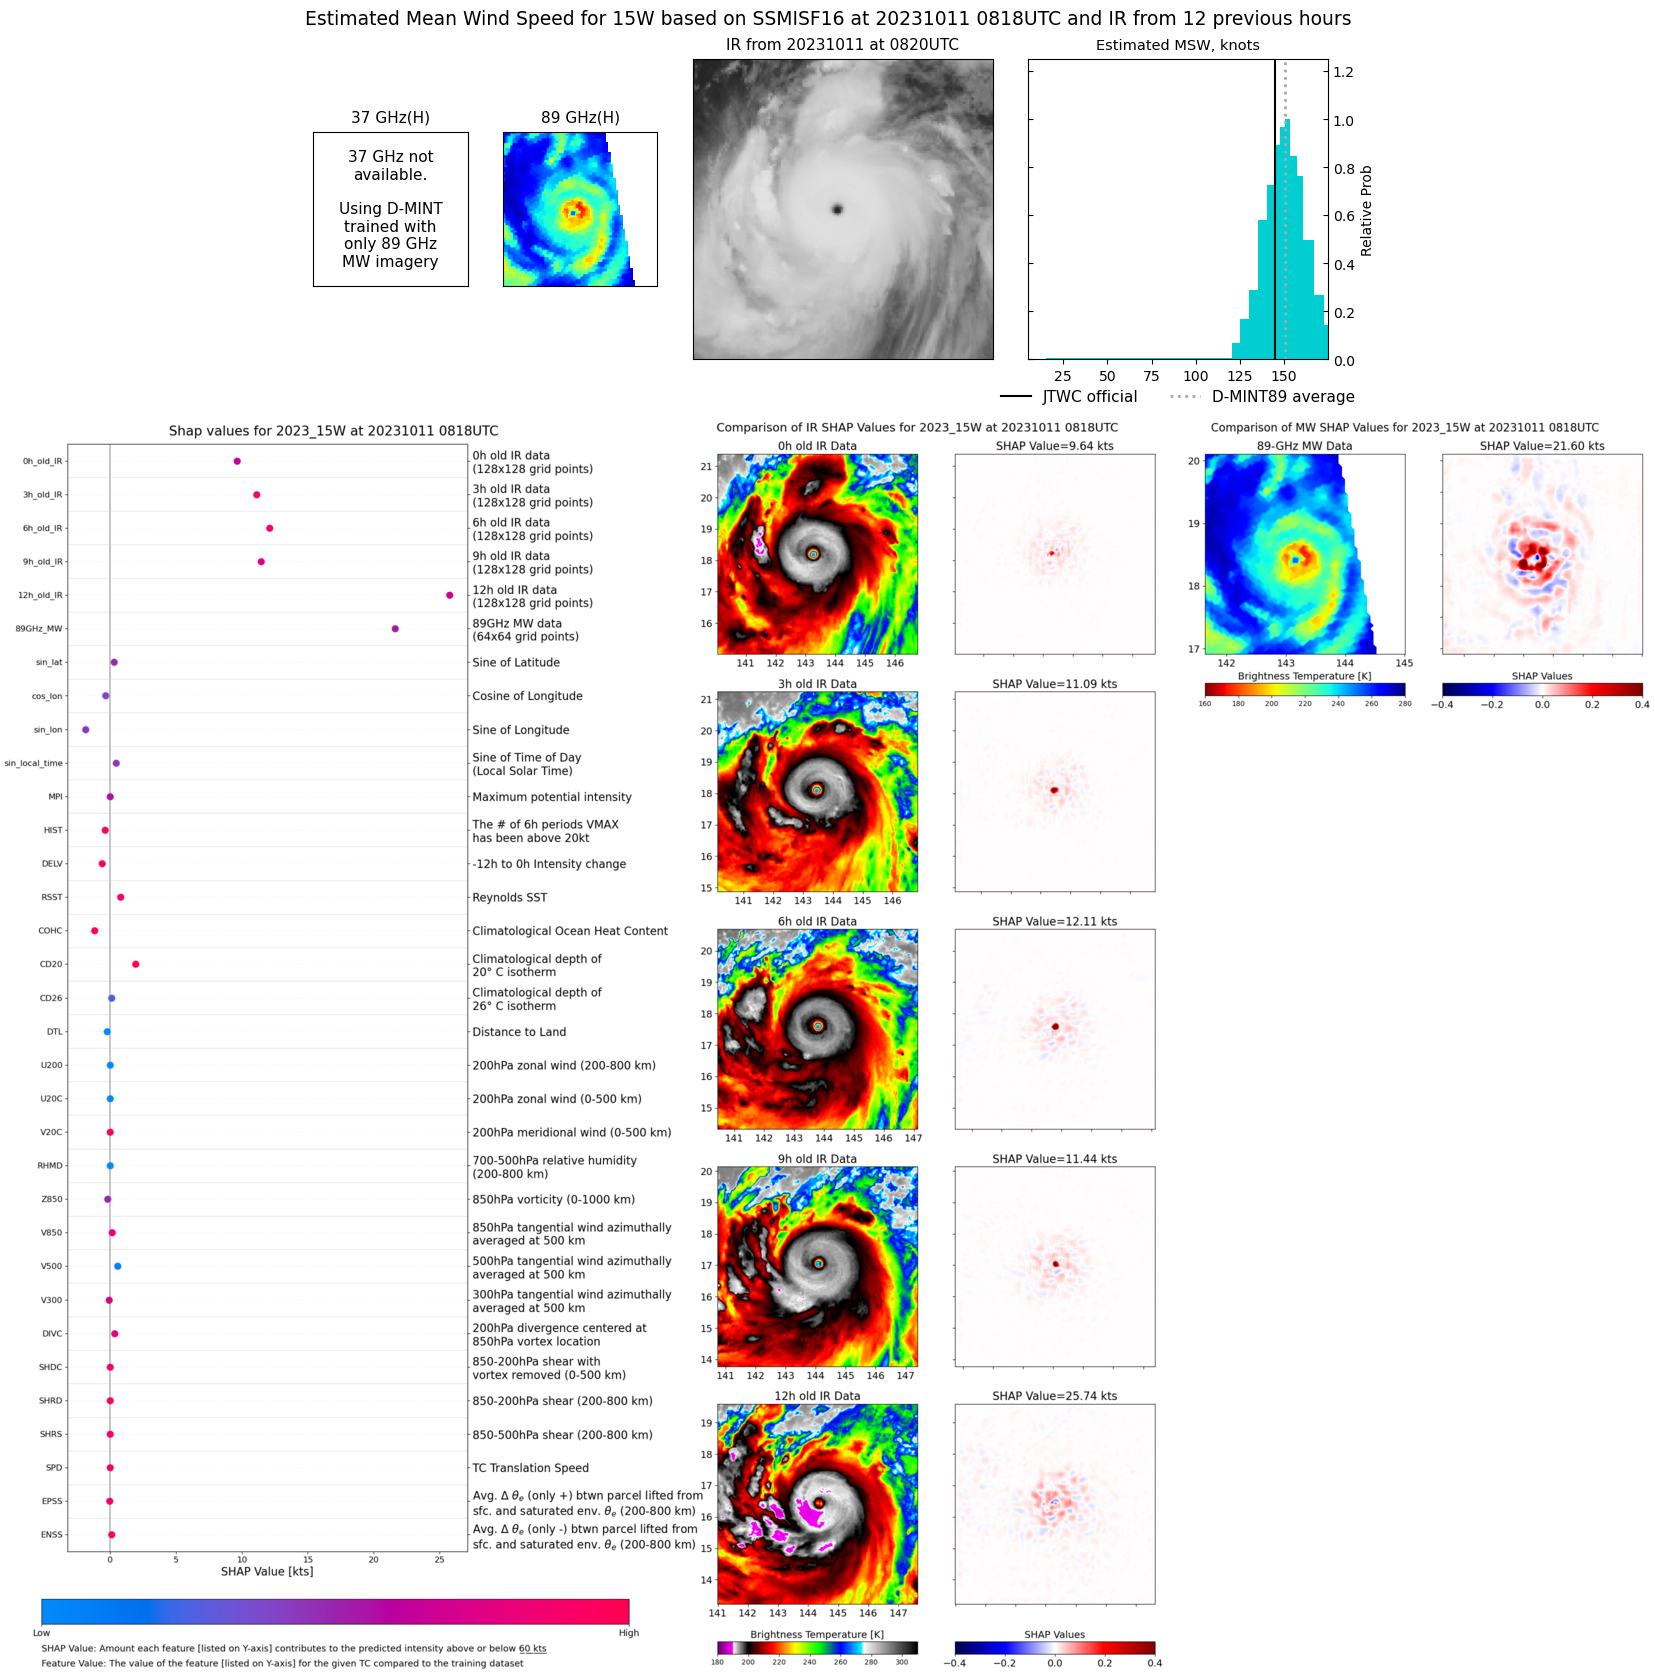
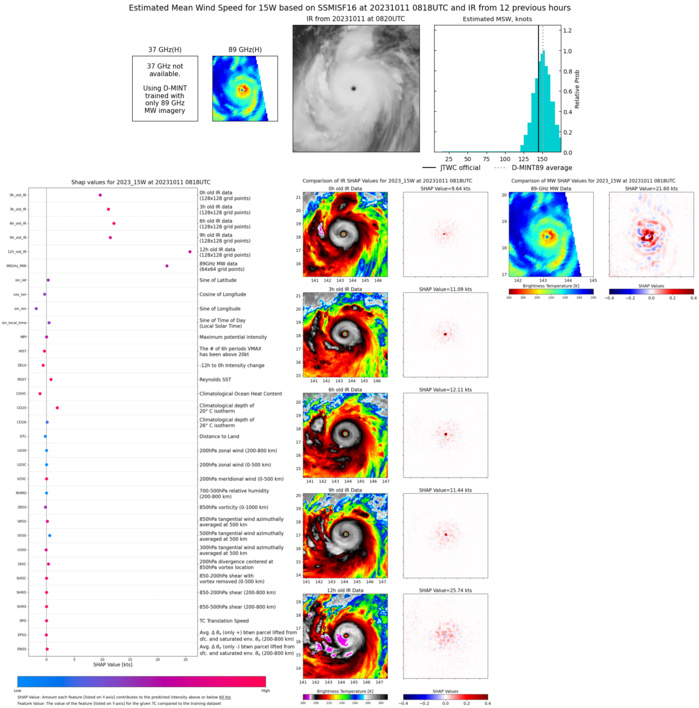
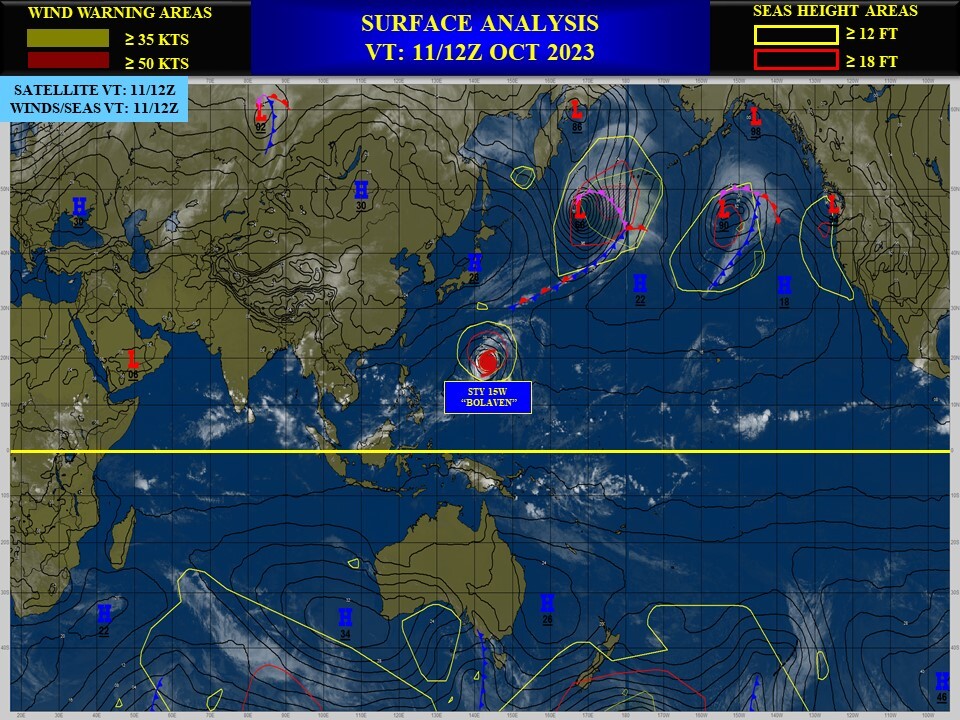
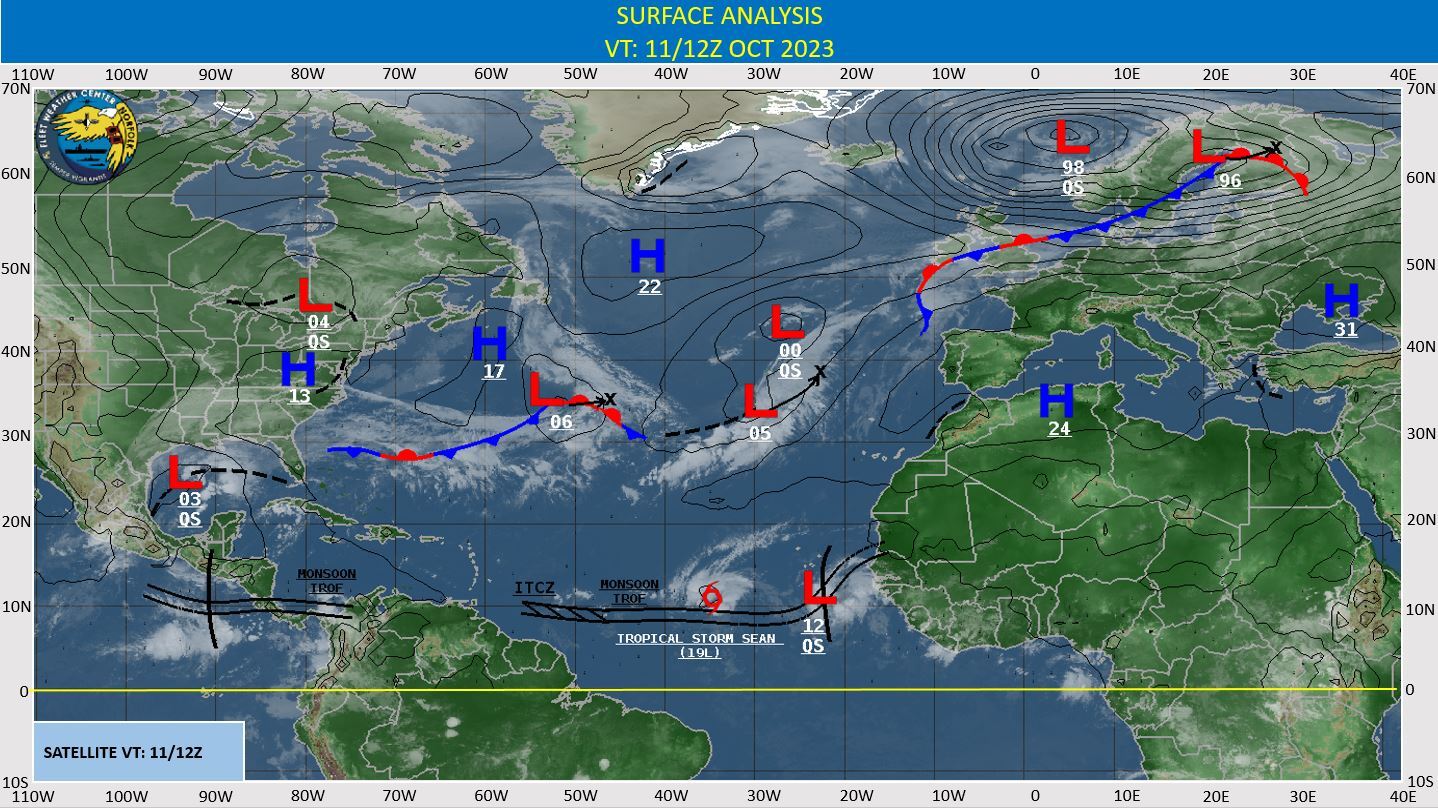
CLICK ON THE IMAGERIES BELOW TO GET THEM ENLARGED
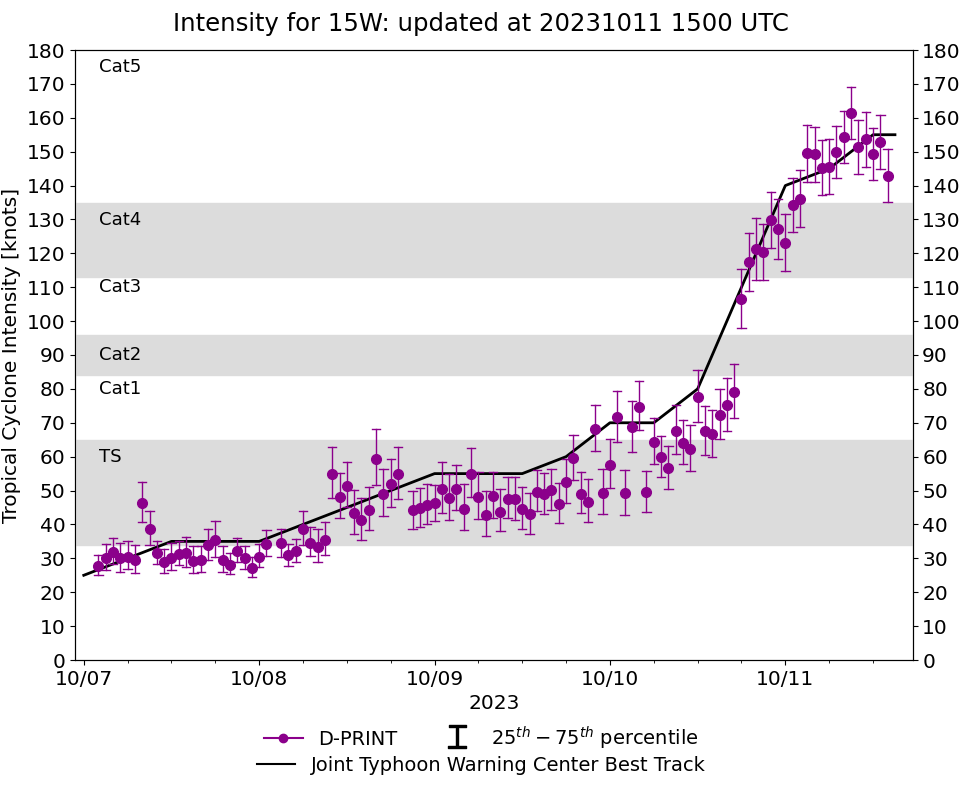
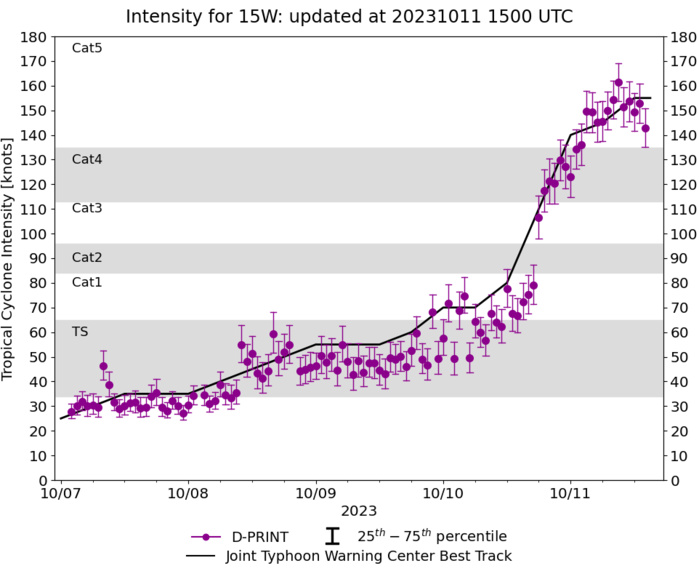
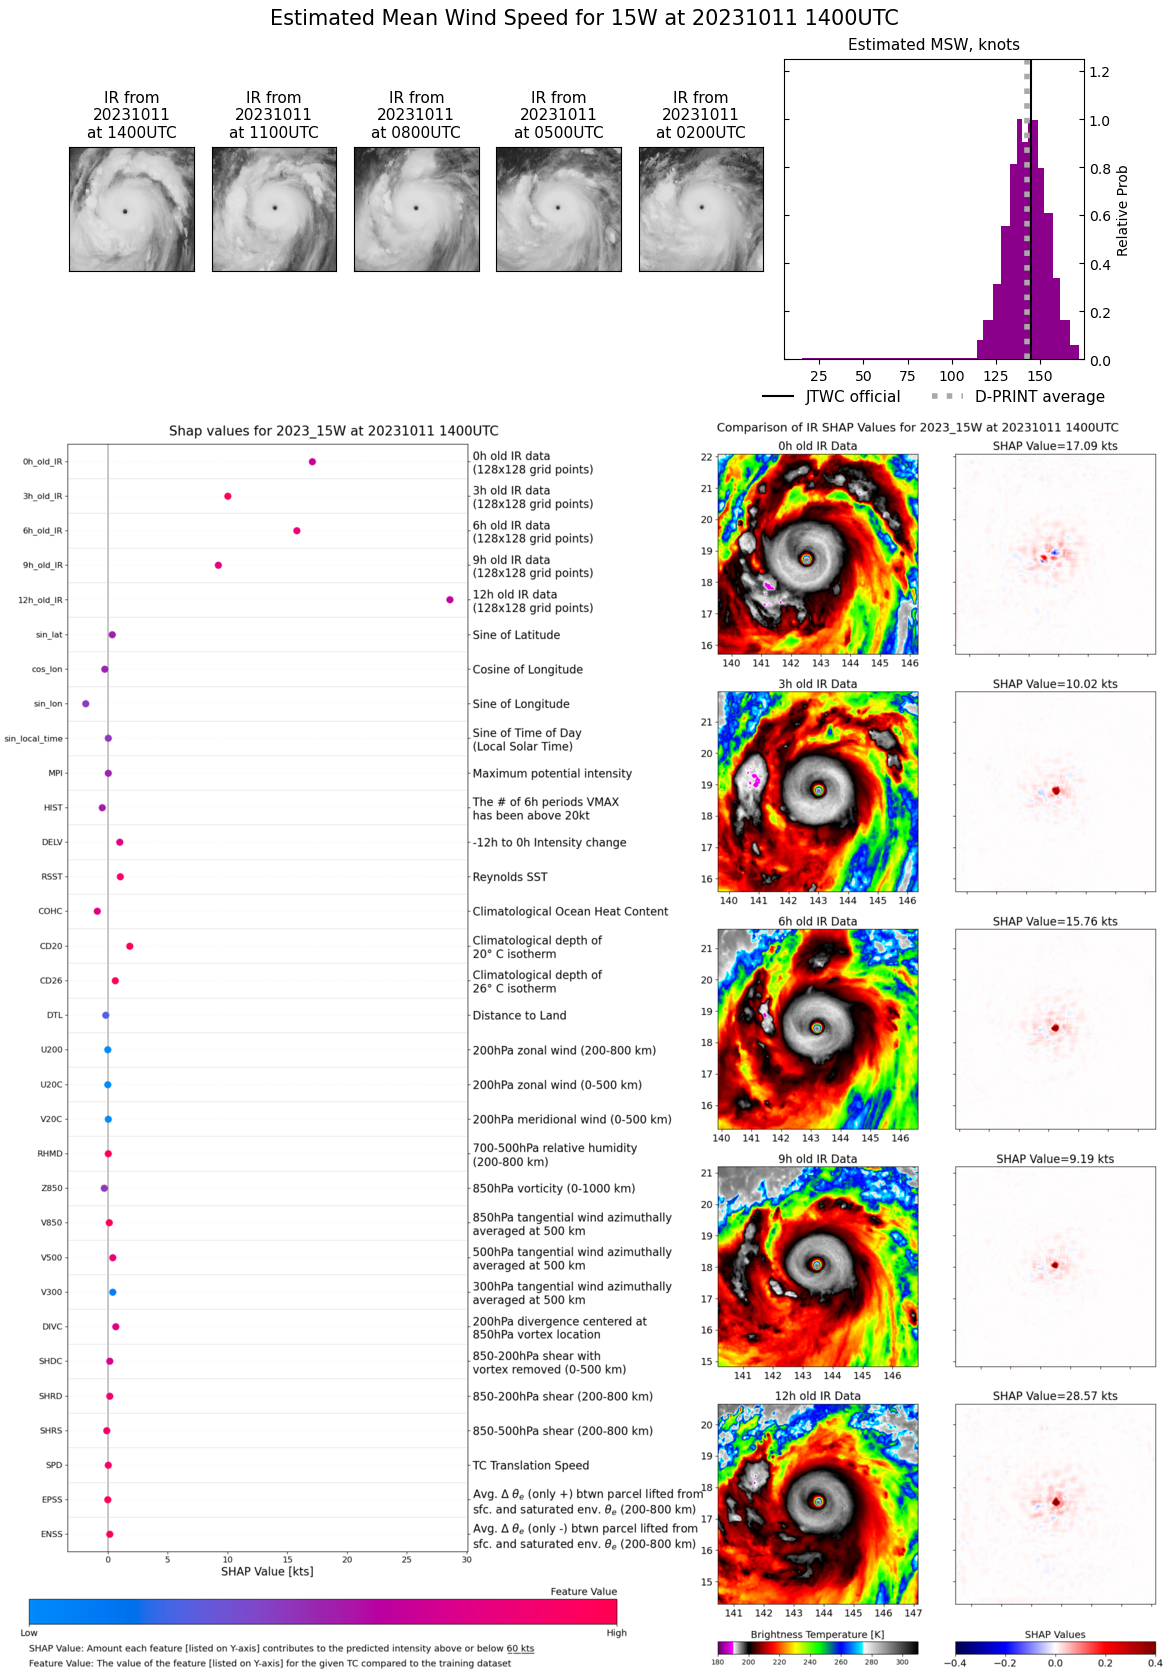
WESTERN NORTH PACIFIC: STY 15WBOLAVEN). CURRENT ESTIMATED INTENSITY IS 155 KNOTS/ CAT 5 US: +75 KNOTS/24H.
1523100818 104N1511E 50
1523100900 108N1503E 55
1523100900 108N1503E 55
1523100906 112N1494E 55
1523100912 120N1485E 55
1523100918 130N1475E 60
1523101000 137N1465E 70
1523101006 143N1455E 70
1523101012 152N1449E 80
1523101018 160N1445E 110
1523101100 171N1440E 140
1523101106 182N1434E 145
1523101112 189N1429E 155
1523100900 108N1503E 55
1523100900 108N1503E 55
1523100906 112N1494E 55
1523100912 120N1485E 55
1523100918 130N1475E 60
1523101000 137N1465E 70
1523101006 143N1455E 70
1523101012 152N1449E 80
1523101018 160N1445E 110
1523101100 171N1440E 140
1523101106 182N1434E 145
1523101112 189N1429E 155
WARNING 19 ISSUED AT 11/15UTC.
CLICK ON THE IMAGERY BELOW TO GET IT ANIMATED AND ENLARGED.
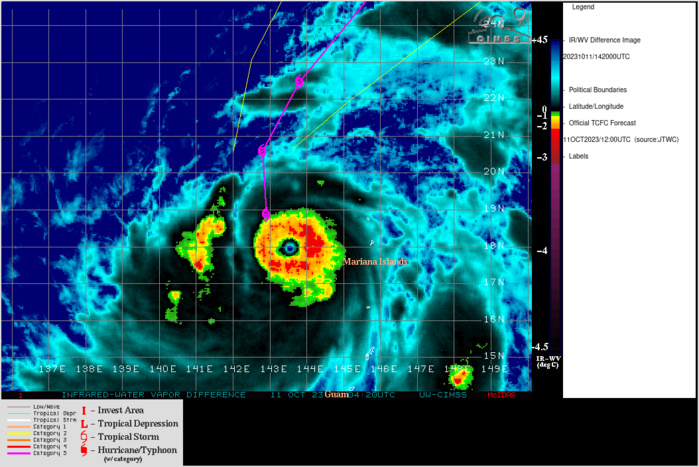
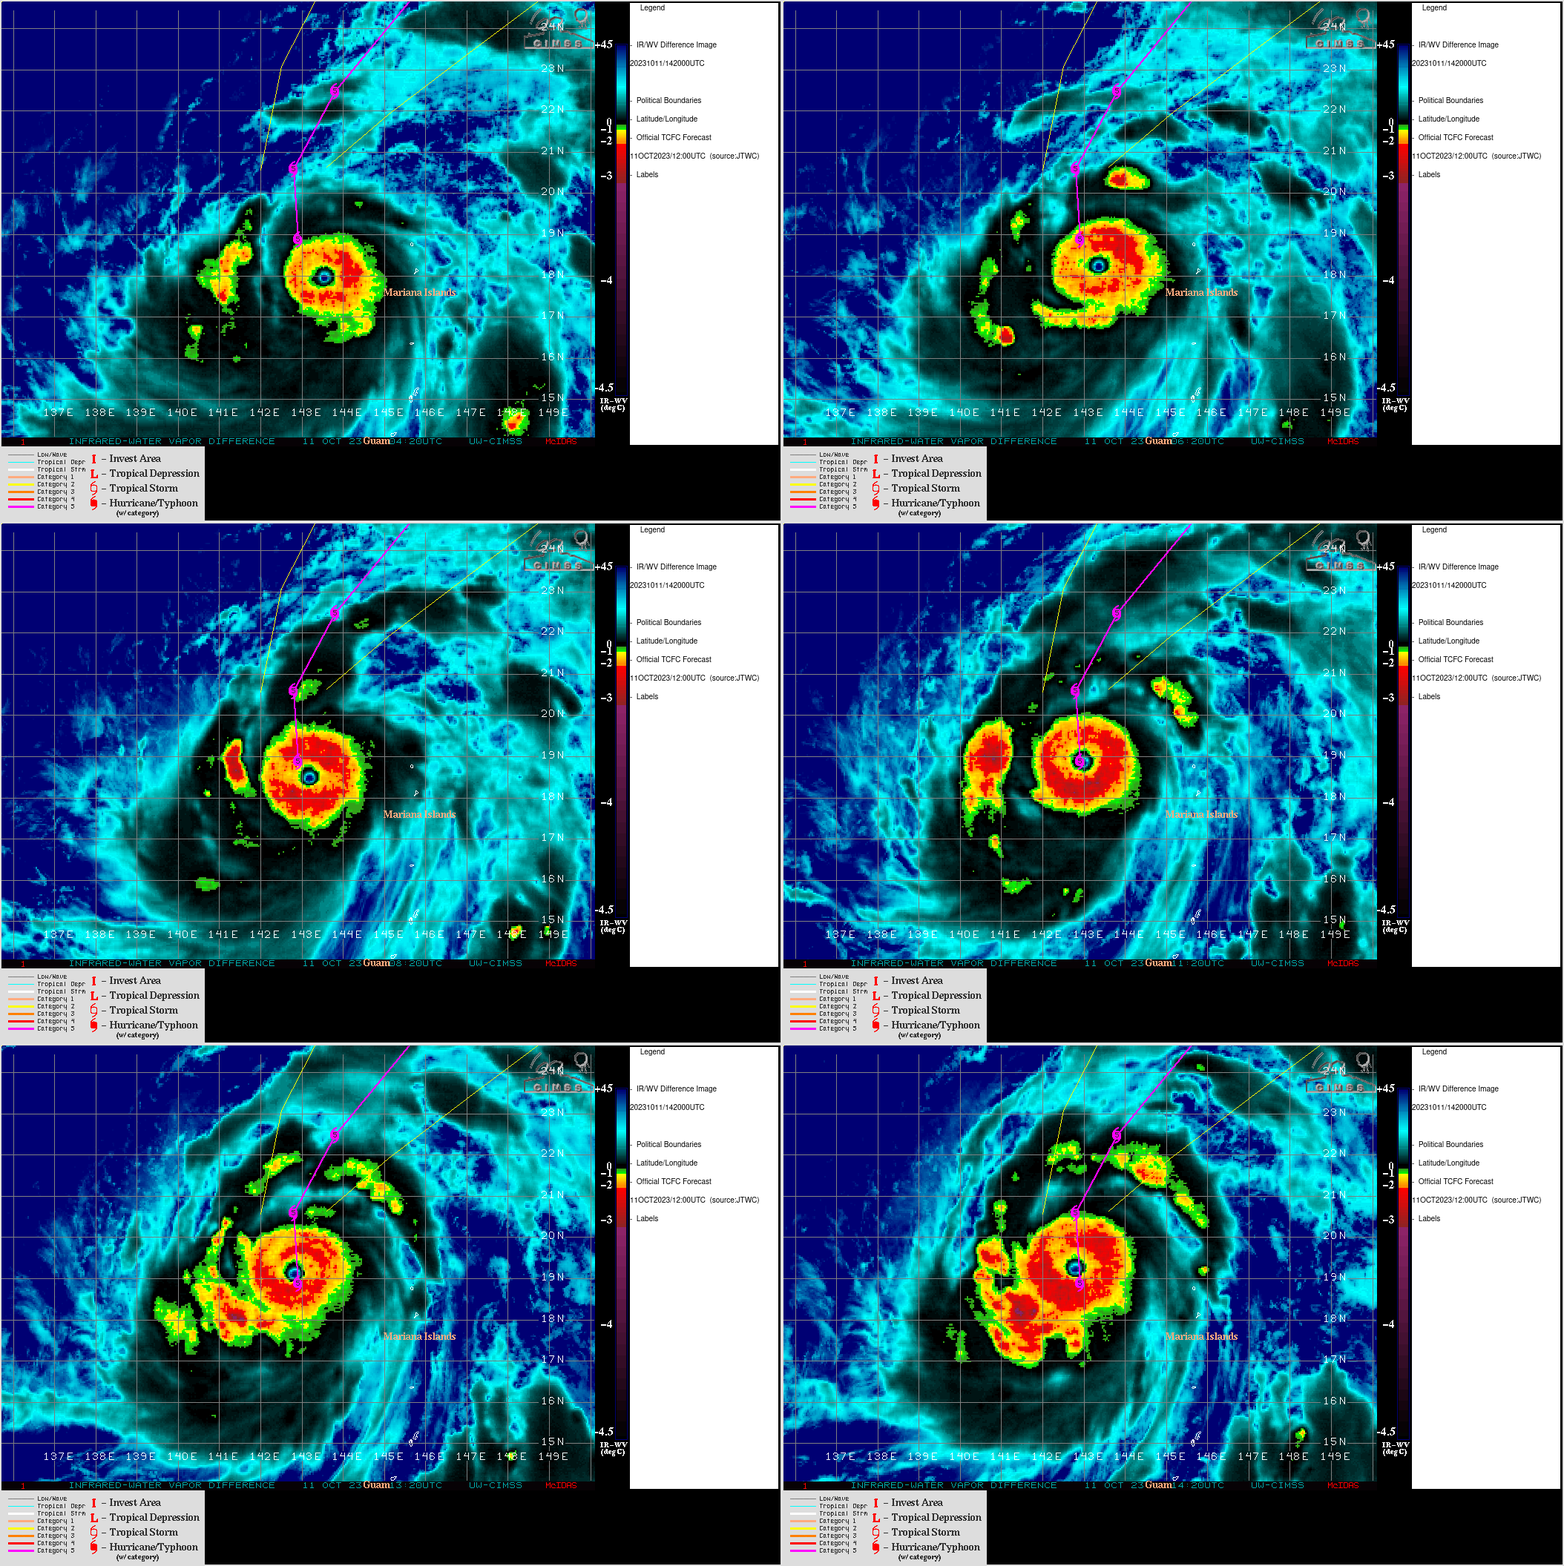
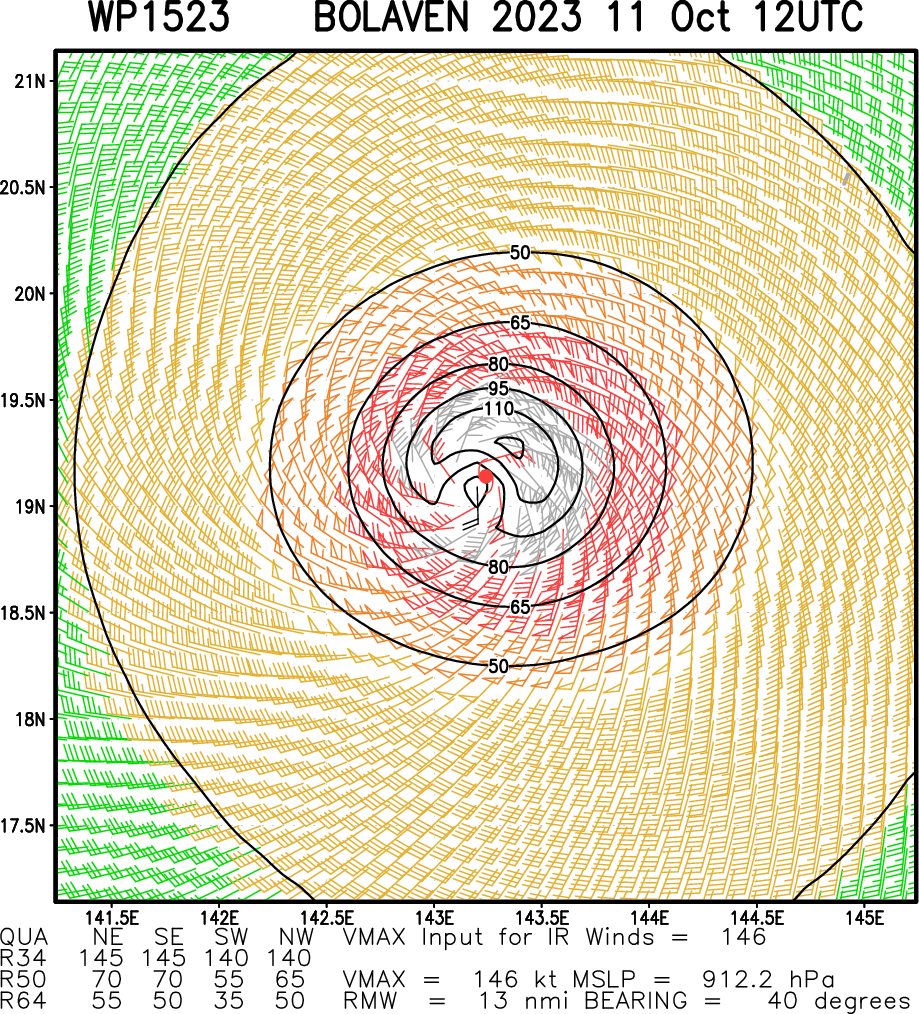
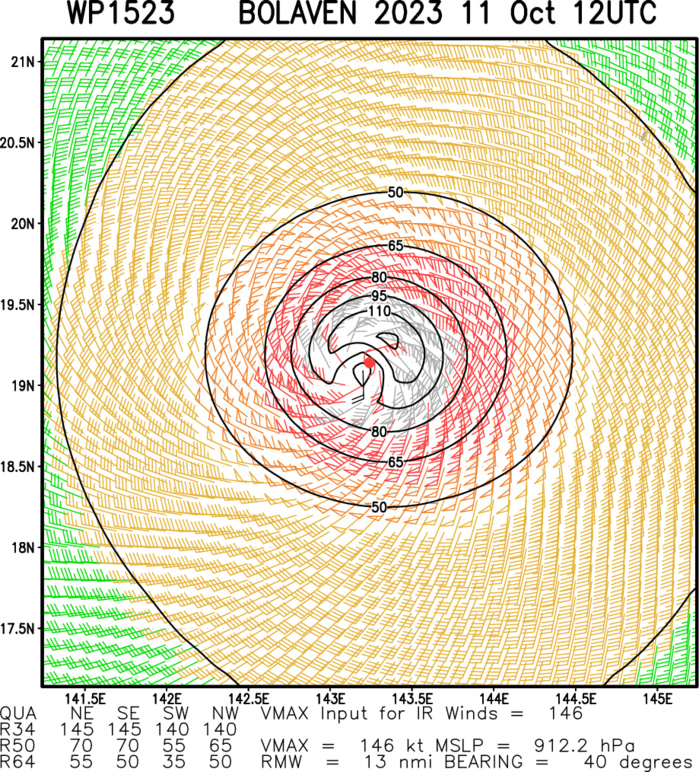
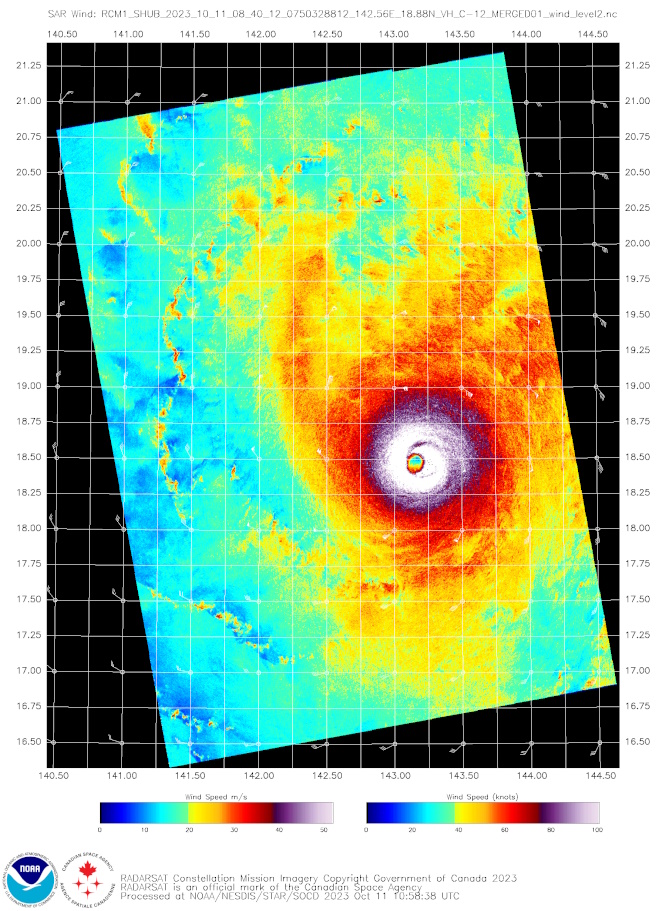
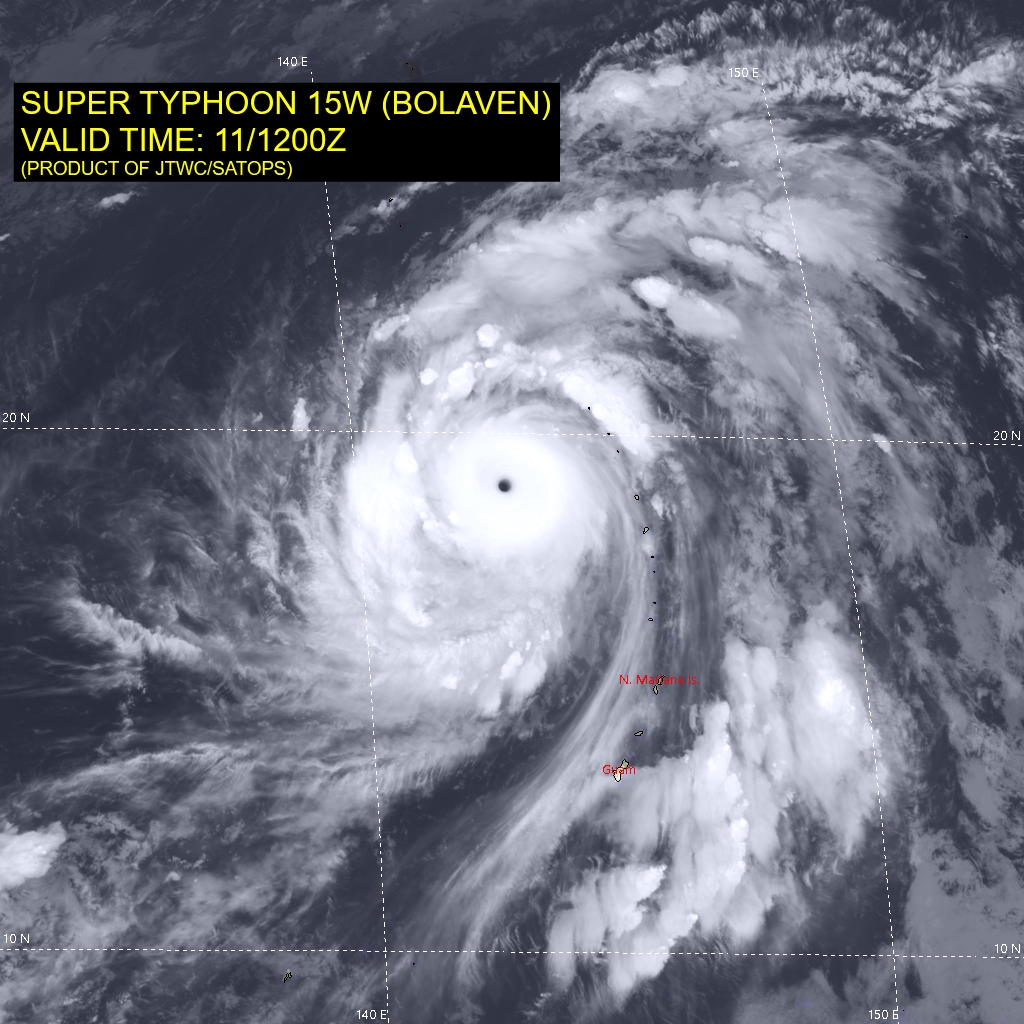
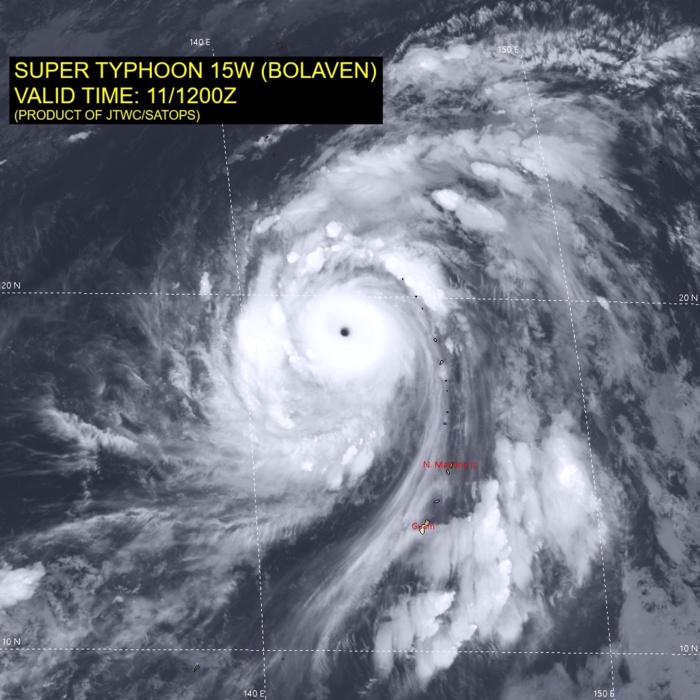
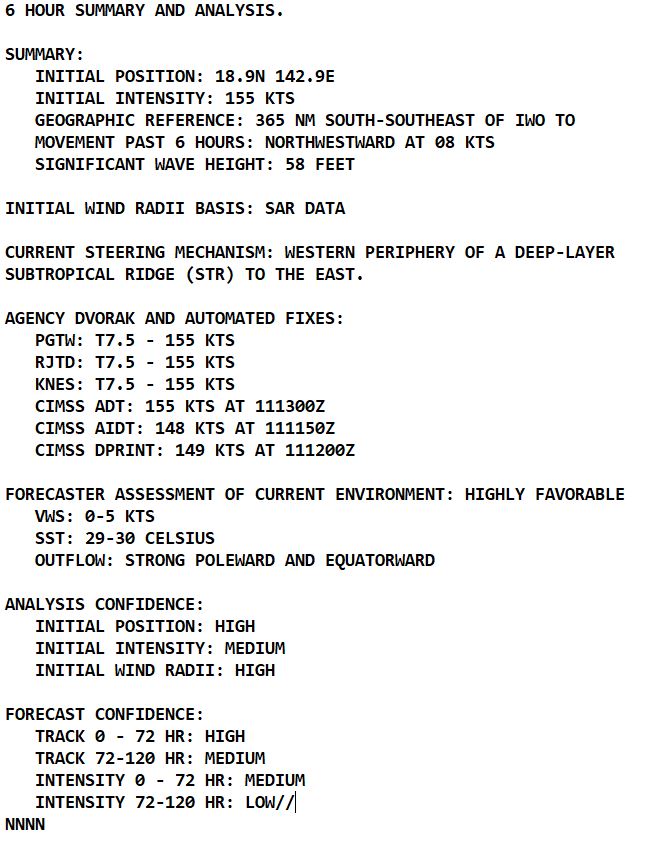
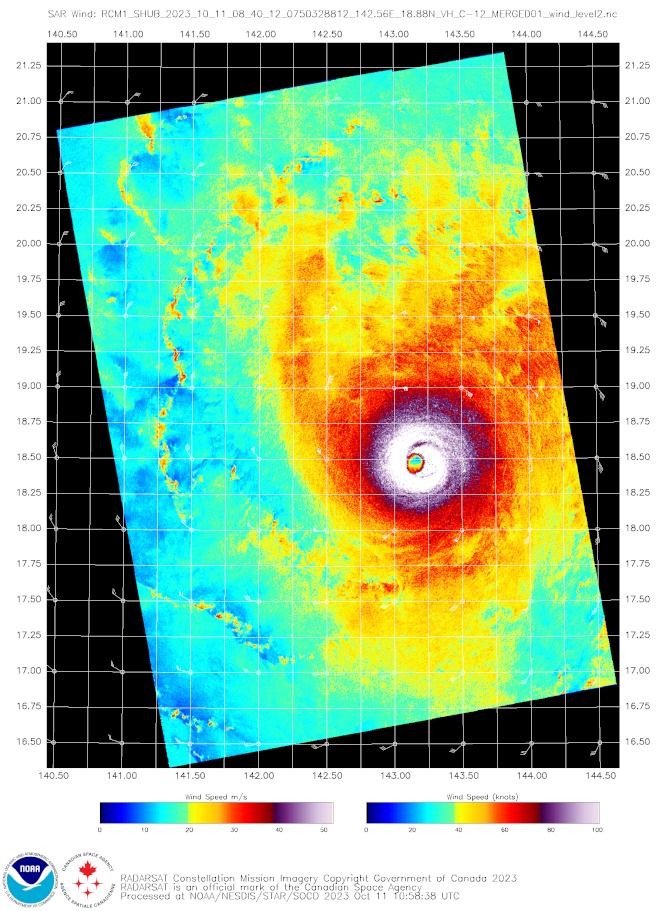
SATELLITE ANALYSIS, INITIAL POSITION AND INTENSITY DISCUSSION: ANIMATED ENHANCED INFRARED (EIR) SATELLITE IMAGERY DEPICTS SUPER TYPHOON (STY) 15W (BOLAVEN) EXPOSING A 14NM WIDE STADIUM EYE, SURROUNDED BY A SMOOTH, VERY SYMMETRIC CONVECTIVE CANOPY SPANNING OUTWARD 80NM FROM THE LOW-LEVEL CIRCULATION CENTER (LLCC). LARGE SPIRAL BANDS OF DEEP CONVECTION INTERMITTENTLY FLARE WITH OVERSHOOTING CLOUD TOPS, OBSERVABLE IN ALL BUT THE SOUTHEAST QUADRANT. EYE TEMPERATURE IS HOVERING AROUND +20C, WHILE CLOUD TOP TEMPERATURES HAVE BOTTOMED AROUND -81C. CLOUD TO GROUND LIGHTNING DATA REVEALS LIGHTNING HAS PERSISTED CONTINUOUSLY IN AND AROUND THE SYSTEMS EYE SINCE THE PREVIOUS WARNING (018). ALL SAID, THIS COMPACT AND VERY WELL-ORGANIZED SUPER TYPHOON HAS MANAGED TO CONSOLIDATE AND INTENSIFY EVEN FURTHER OVER THE PAST SIX HOURS. THE INITIAL POSITION IS ASSESSED WITH HIGH CONFIDENCE BASED A 111200Z HIMAWARI-9 EIR IMAGE. THE INITIAL INTENSITY IS ASSESSED WITH MEDIUM CONFIDENCE BASED ON SUBJECTIVE AND OBJECTIVE INTENSITY ESTIMATES LISTED BELOW AND EXTRAPOLATION OF A 110840Z RCM-1 SAR IMAGE SHOWING A MAXIMUM WIND VELOCITY OF 147KTS. WIND RADII WERE ADJUSTED TO PARALLEL THE AFOREMENTIONED SAR DATA.
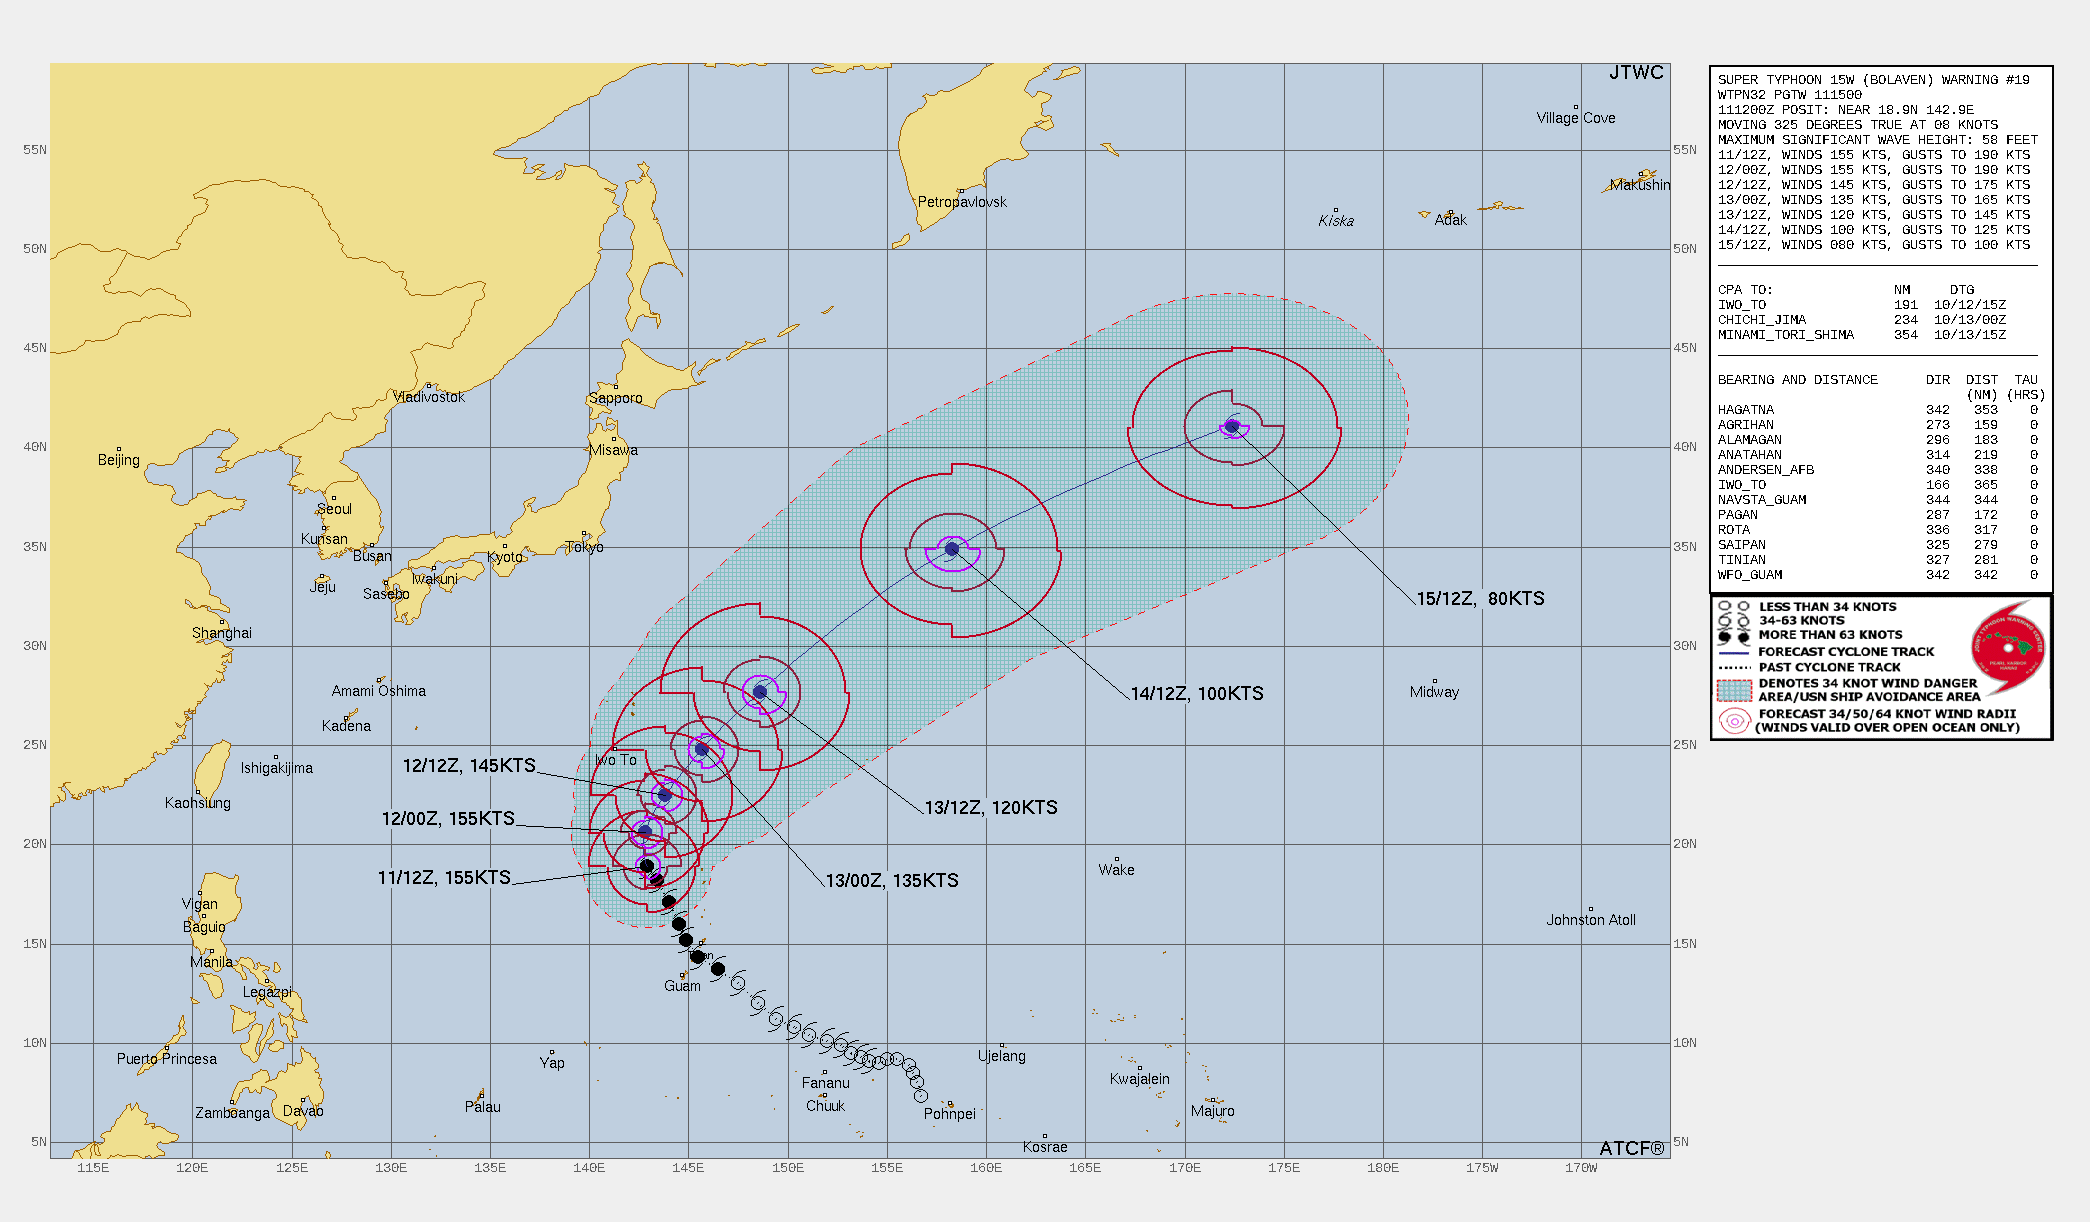
TC Warning Graphic
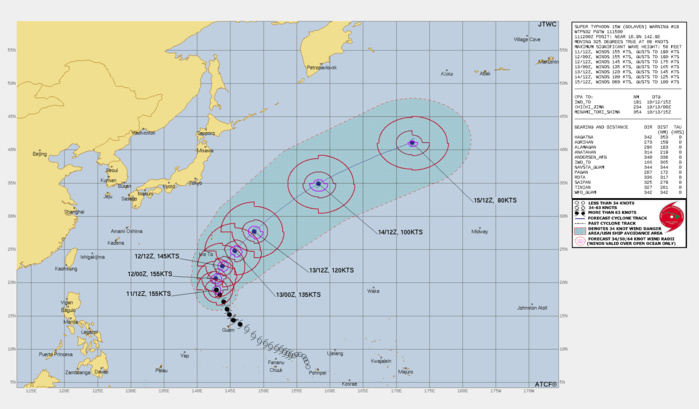
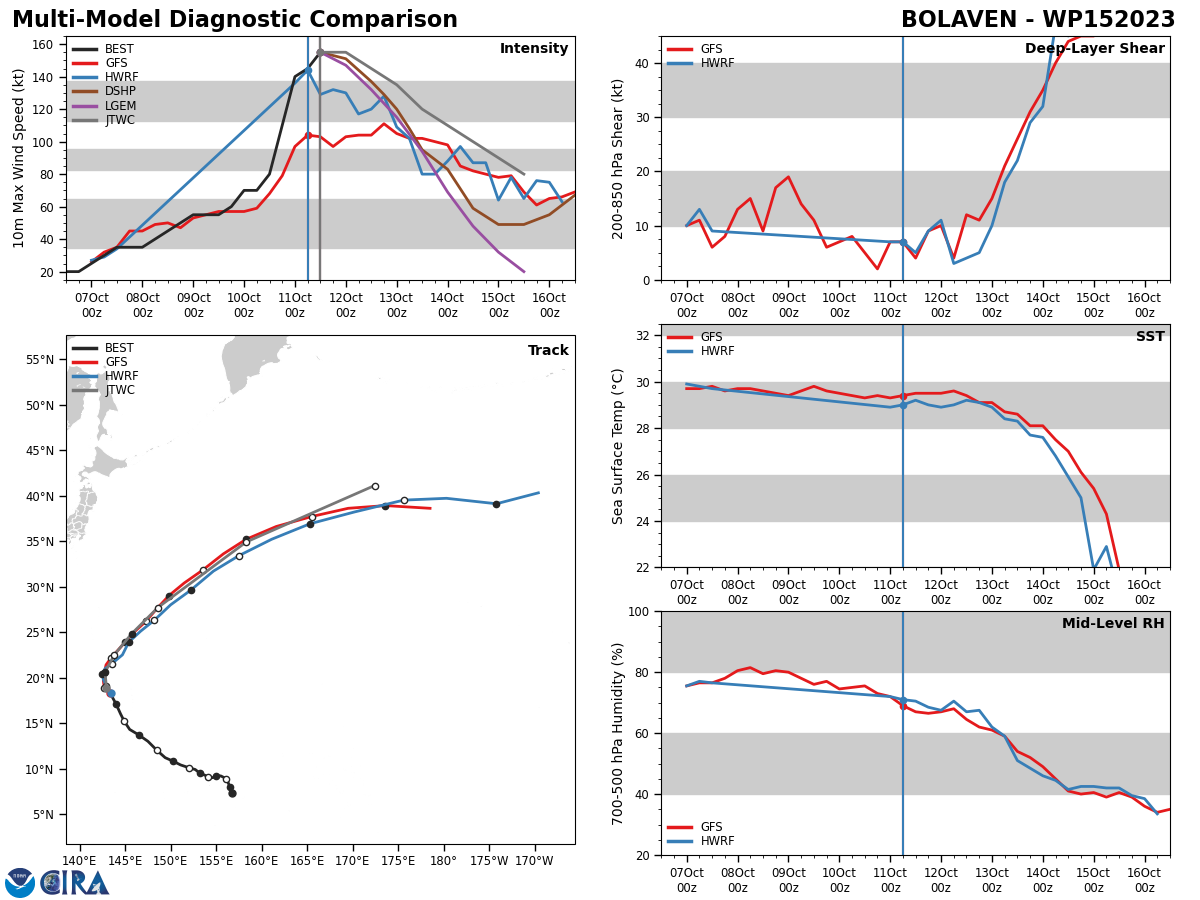
FORECAST REASONING. SIGNIFICANT FORECAST CHANGES: THERE ARE NO SIGNIFICANT CHANGES TO THE FORECAST FROM THE PREVIOUS WARNING. FORECAST DISCUSSION: STY 15W IS FORECAST TO MAINTAIN CURRENT INTENSITY THROUGH TAU 12 ON A NORTHWARD TRAJECTORY. BETWEEN TAU 12 AND TAU 24, INTENSITY IS EXPECTED TO GRADUALLY BEGIN TO FALL AS STY 15W TURNS TO A NORTHEASTWARD TRACK. AFTER TAU 24, THE ENVIRONMENT STARTS TO BECOME LESS FAVORABLE. VERTICAL WIND SHEAR IS ANTICIPATED TO SLOWLY ONSET AND BECOME SIGNIFICANT (+30KTS) BY TAU 48. ADDITIONALLY, DRY AIR (LESS THAN 30 PERCENT RELATIVE HUMIDITY) ALONG THE WESTERN PERIPHERY WILL BEGIN WRAPPING AROUND AND INTO THE VORTEX NEAR TAU 39. BOTH FACTORS WILL INHIBIT INTENSIFICATION AND SLOWLY DECAY STORM STRUCTURE THROUGH TAU 96. THE SYSTEM WILL PASS THE 26C ISOTHERM AS IT CROSSES 35N AND BEGIN EXTRATROPICAL TRANSITION (ETT) AROUND TAU 72. RAPID TRANSITION TO TYPHOON STRENGTH, WARM SECLUSION TYPE EXTRATROPICAL LOW IS EXPECTED BY TAU 96 TO THE SOUTH-SOUTHWEST OF KISKA ISLAND.
Model Diagnostic Plot
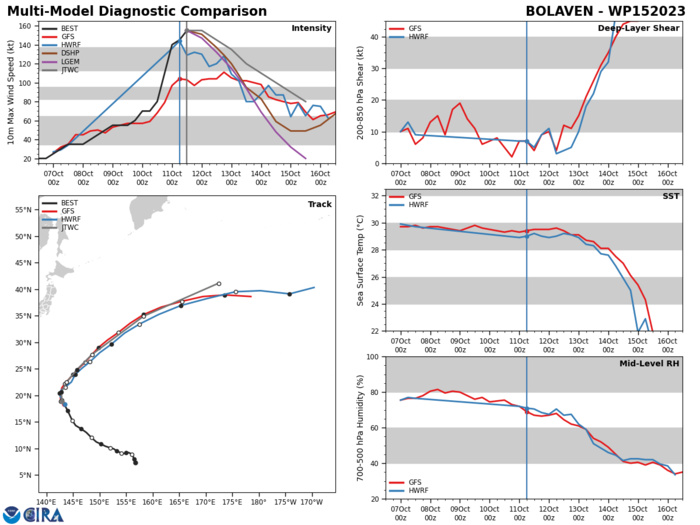
MODEL DISCUSSION: GLOBAL NUMERICAL MODEL GUIDANCE REMAINS IN GOOD AGREEMENT THROUGH TAU 72, AND FAIR AGREEMENT BY TAU 120. AT TAU 72, THE FURTHEST TRACK SEPARATION OF JTWC CONSENSUS MEMBER IS BETWEEN THE JGSM AND GFS SOLUTIONS, WITH A CROSS-TRACK SPREAD OF 181NM. ALONG-TRACK SPREAD OF 398NM IS GREATEST BETWEEN GFS AND ECMWF SOLUTIONS. BY TAU 120, BOTH SPREADS AMONG JTWC CONSENSUS MEMBERS INCREASE; NAVGEM AND GFS SOLUTIONS EXHIBIT A CROSS TRACK-SPREAD OF 422NM, WHILE GFS AND UKMET SHARE AN ALONG-TRACK SPREAD OF 425NM. INTENSITY GUIDANCE UNIFORMLY SUGGESTS THE SYSTEM INTENSITY HAS LIKELY PEAKED AND WILL GRADUALLY TREND DOWNWARD AFTER A BRIEF SUSTAINMENT PERIOD THROUGH TAU 12.
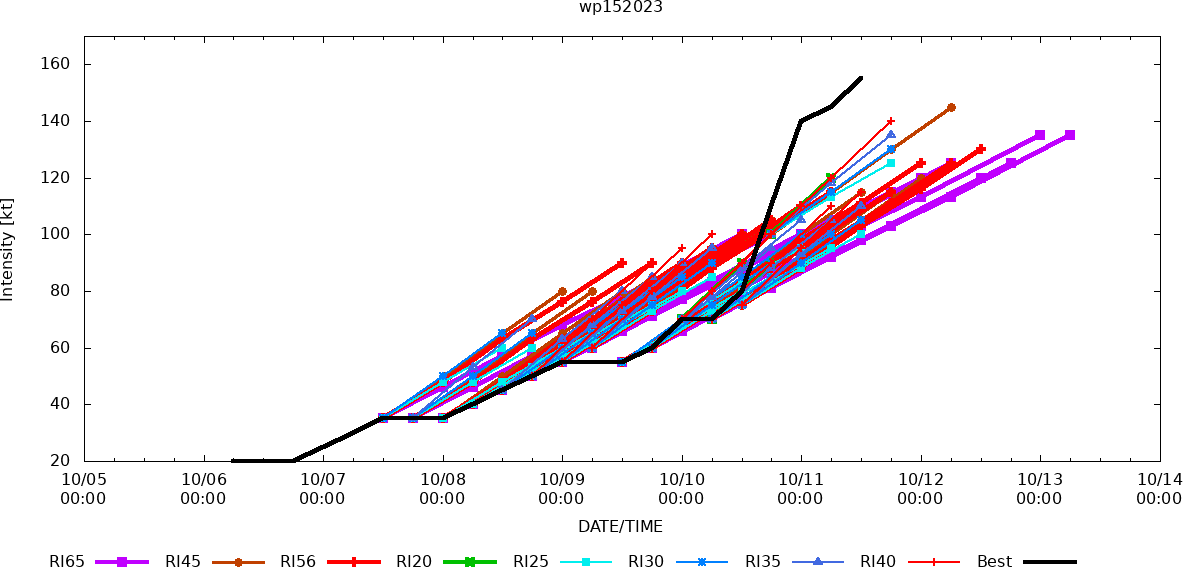
RIPA Forecast
Multiplatform Satellite Surface Wind Analysis (Experimental)
RCM-1, STAR Synthetic Aperture Radar 3KM Wind Speed Analysis 2023-10-11 8:40 UTC : 1 MINUTE MAXIMUM WINDS: 147 KNOTS
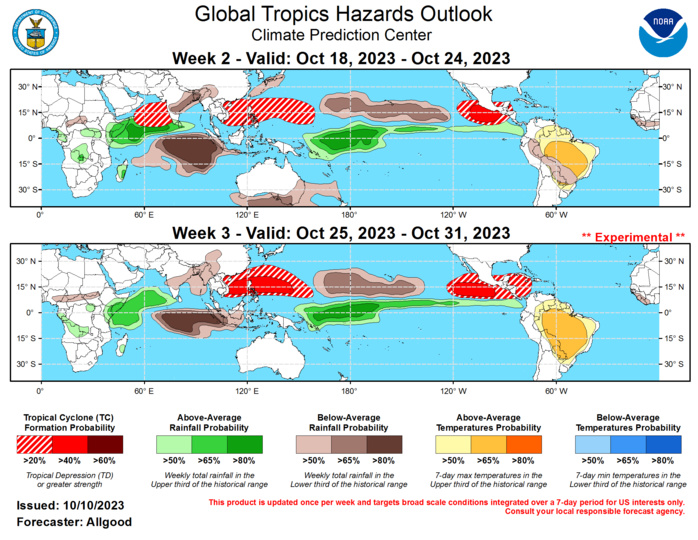
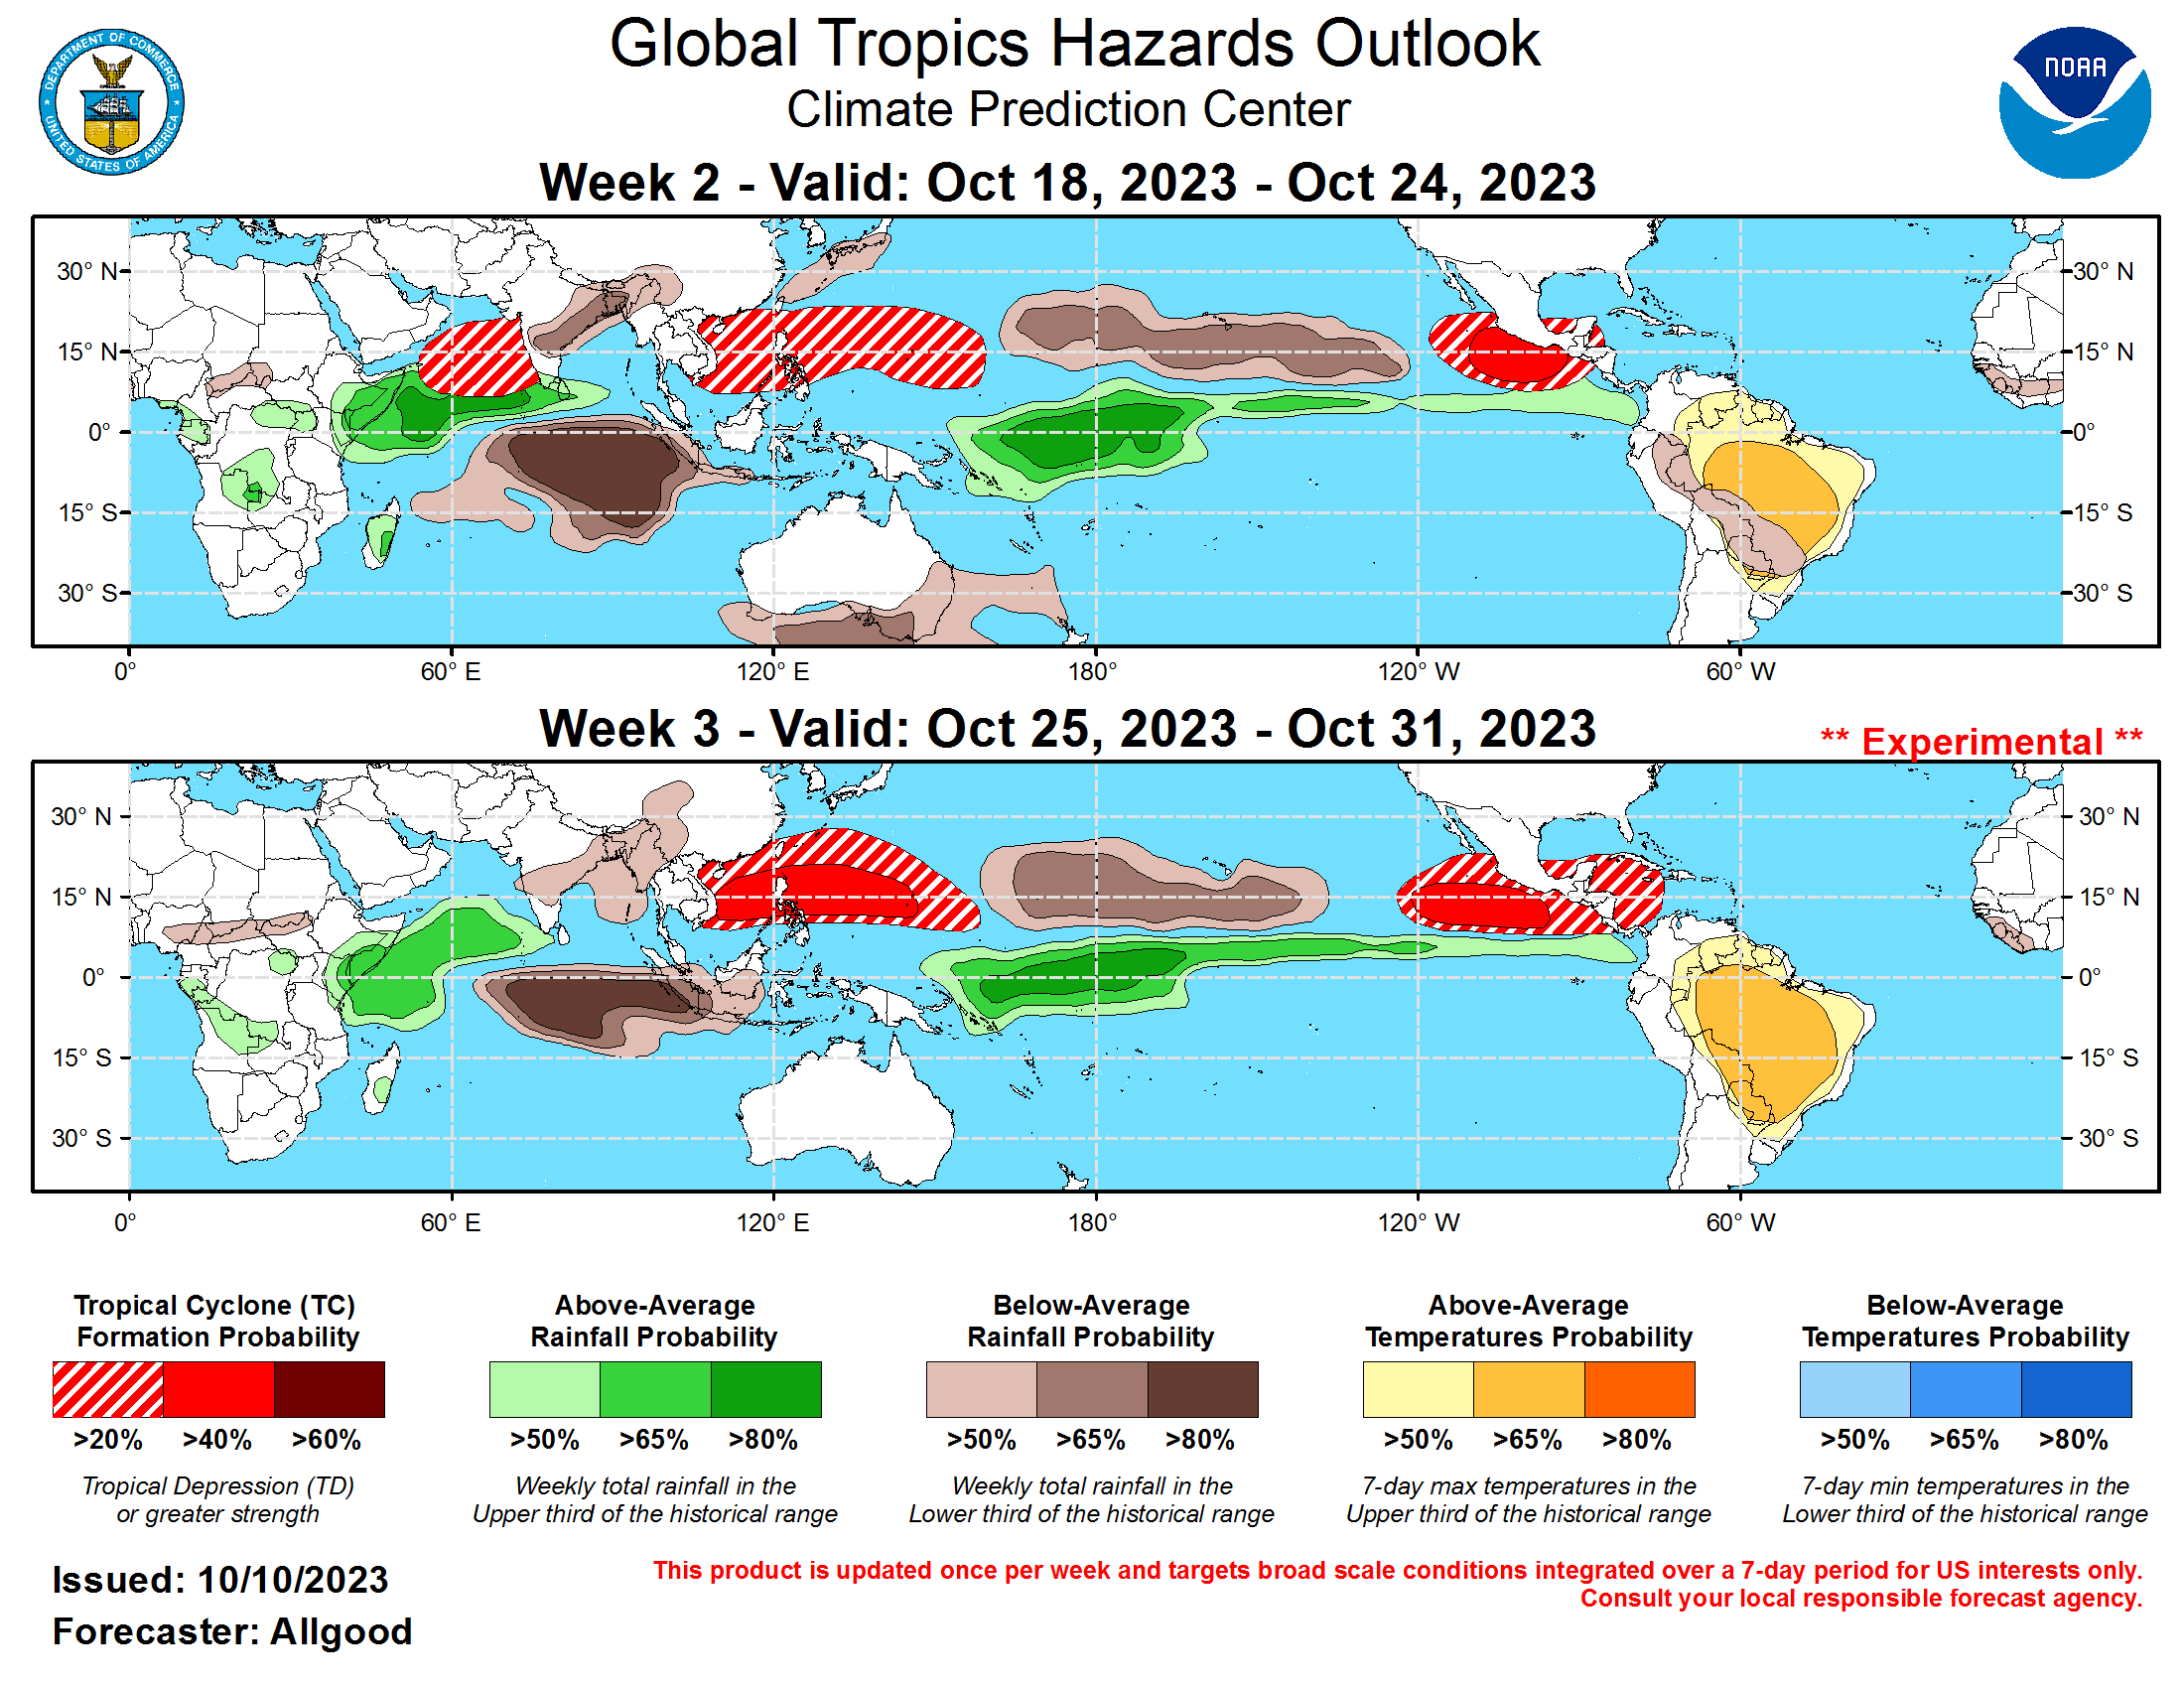
GTH Outlook Discussion Last Updated - 10/10/23 Valid - 10/18/23 - 10/31/23 The Madden-Julian Oscillation (MJO) remains active, with the CPC upper-level velocity potential index depicting a strong event with a phase speed on the high end of the canonical envelope. The RMM-based MJO index has also reflected higher amplitudes over the past several days, and currently places the enhanced phase of the MJO over the Western Hemisphere. The atmospheric response to ongoing El Nino conditions is also playing a substantial role in the global tropical convective pattern, with enhanced convection persisting near and west of the Date Line and a well established subtropical jet stream over the Northeast Pacific extending across the southern tier of the CONUS. Recently, a strong westerly wind burst centered over the Equator was observed over the far West Pacific, associated with a broad monsoonal trough with embedded tropical cyclone activity. This event should promote renewed downwelling oceanic Kelvin wave activity, which would further reinforce or strengthen the ENSO response over the coming weeks to months. The forecast evolution of the intraseasonal signal is highly uncertain. As the MJO continues propagating eastward, its signal will increasingly interfere destructively with the ENSO base state. Additionally, a strongly positive Indian Ocean Dipole (IOD) event is underway, with above (below)-normal SSTs over the western (eastern) Indian Ocean providing a second stationary signal to interfere with the progression of the MJO. Dynamical model forecasts from the ECMWF show the IOD event growing increasingly dominant, with the suppressed convective signal over the eastern Indian Ocean becoming the highest amplitude signal in the global tropics OLR anomaly field. Therefore, this outlook is based on an anticipated weakening of the MJO over the next several weeks, with the positive IOD and El Nino signals serving as the main drivers of the global tropical convective pattern. The resulting Global Tropics Hazards (GTH) Outlook therefore reflects a broadly stationary signal during Weeks 2 and 3. Hurricane Lidia, which formed just prior to the issuance of last week’s GTH outlook, turned east-northeastward while intensifying and is currently forecast to make landfall over the west-central coastline of Mexico, bringing significant wind, rain, and storm surge impacts. Tropical Storm Max formed just off the coast of southern Mexico on October 9, quickly making landfall and dissipating. Over the West Pacific, Typhoon Bolaven is currently passing just north of Guam, and is forecast to continue intensifying before recurving over the northern Pacific, eventually becoming a potent extratropical storm and likely influencing the midlatitude pattern over North America. Over the next week, the Atlantic main development region (MDR) is anticipated to remain unusually active for mid-October, with the National Hurricane Center (NHC) depicting a high probability for new tropical cyclone development. Dynamical model forecasts have shown the basin becoming increasingly quiet during Week-2, though additional development cannot be ruled out given the abnormally warm SSTs in the region. The East Pacific is favored to remain active during Weeks 2 and 3, while increasing Central American Gyre activity may also increasingly favor genesis over the western Caribbean or southern Gulf of Mexico by Week-3. While the signal favoring development is rather strong over the western Caribbean by Week-3, confidence is somewhat reduced due to a potential for subsidence from any East Pacific tropical cyclone activity. Elsewhere, tropical cyclone activity is possible across the West Pacific, with the strongest signal in the dynamical model guidance over the South China Sea and in the vicinity of the Philippines. Additionally, dynamical models favor potential formation over the Arabian Sea during Week-2. The precipitation outlook for the next two weeks is based on the anticipated dominance of the stationary IOD and El Nino signals, and a consensus of GEFS, CFS, Canadian, and ECMWF ensemble mean solutions. Therefore, above (below) average precipitation is favored for the western (eastern) Indian Ocean, and the central and eastern Pacific. A continued hot, somewhat dry pattern is favored for much of northern South America, which will increasingly stress crops undergoing reproduction. For hazardous weather conditions in your area during the coming two-week period, please refer to your local NWS office, the Medium Range Hazards Forecast produced by the Weather Prediction Center, and the CPC Week-2 Hazards Outlook. Forecasts made over Africa are made in coordination with the International Desk at CPC.


